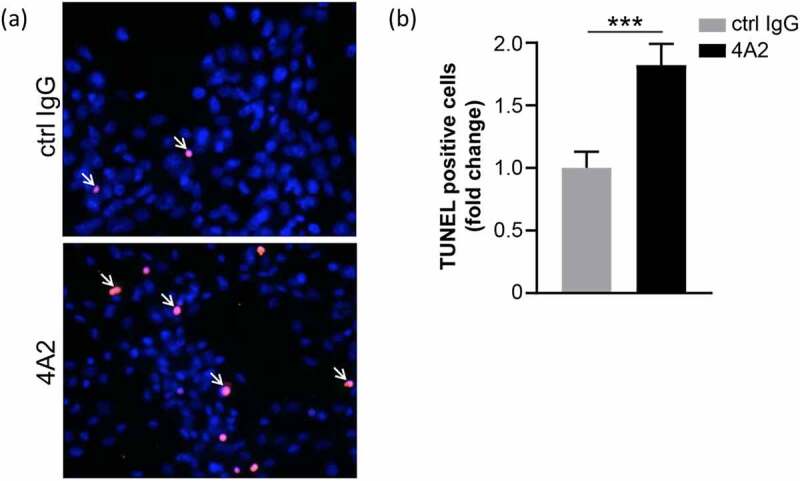
Figure 8.

U87 MG glioblastoma cells treated with 100 μg/ml m4A2 or control mouse IgG antibody for 72 hours in hypoxia. After fixation a TUNEL assay was performed. (a) Representative images demonstrating the presence of TUNEL-positive U87MG cells (red, arrows). Nuclei are in blue. (b) Bar graph showing quantification of TUNEL-positive cells. Data show the mean fold change ± s.e.m. of technical replicates and are representative of 2 independent experiments N = 10 fields of view at 20x. ***P < .001
