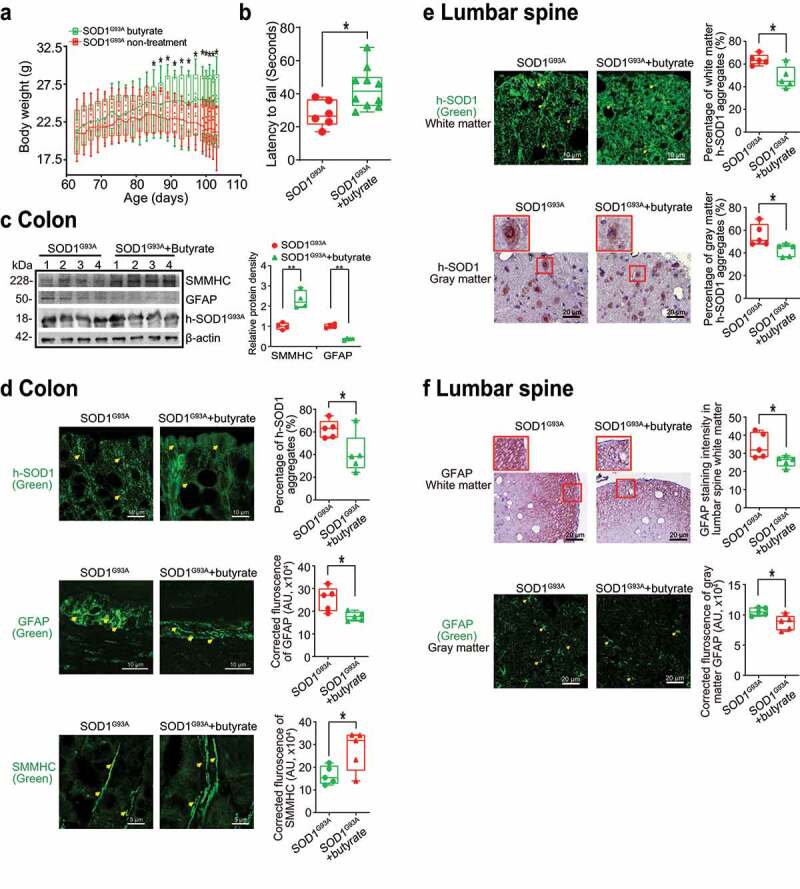
Figure 5.

Butyrate treatment led to reduced human-SOD1G93A aggregation, and enhanced ENS and muscle function in intestine and neurons of SOD1G93A mice. (a) Body weight changes of SOD1G93A mice after butyrate treatment. Male or female SOD1G93A mice were treated with or without 2% butyrate in the drinking water starting from 63 days (2.1 months) to 101 days (3.4 months). Butyrate treated SOD1G93A mice started to show less weight loss from the age of 83 days (1.4 months), compared to the no-treatment SOD1G93A mice. Each data point represents the average body weight. (Data are expressed as mean ± SD. n = 6–10, two-way ANOVA test, *P < .05). (b) SOD1G93A mice with butyrate treatment showed a significantly increased rotarod test time. At age 14–15 weeks, the mice were subjected to the trial on the accelerating spindle (4 to 40 rpm) for 300 seconds. Latency to fall was recorded when the mouse fell from the rod. Each mouse was tested in 4 trials per day for 2 consecutive days. The mean times for 8 trials of the tests were calculated for each mouse. (Data are expressed as mean ± SD. n = 6–10, Welch’s t-test, *P < .05). (c) Butyrate treatment led to increased SMMHC and decreased GFAP expression in SOD1G93A mice. (Data are expressed as mean ± SD. n = 4, student t-test, **P < .01). (d) Reduced human-SOD1G93A aggregation, decreased GFAP expression and enhanced SMMHC expression in intestine of SOD1G93A mice with butyrate treatment. Images are from a single experiment and are representative of 5 mice per group. (Data are expressed as mean ± SD. n = 5, Welch’s t-test, *P < .05). (e) Reduced human-SOD1G93A aggregation in lumbar spine of SOD1G93A mice with butyrate treatment. Images are from a single experiment and are representative of 5 mice per group. (Data are expressed as mean ± SD. n = 5, Welch’s t-test, *P < .05).(f) Decreased GFAP expression in lumbar spine of SOD1G93A mice with butyrate treatment. Images are from a single experiment and are representative of 5 mice per group. (Data are expressed as mean ± SD. n = 5, Welch’s t-test, *P < .05)
