
Figure 1.
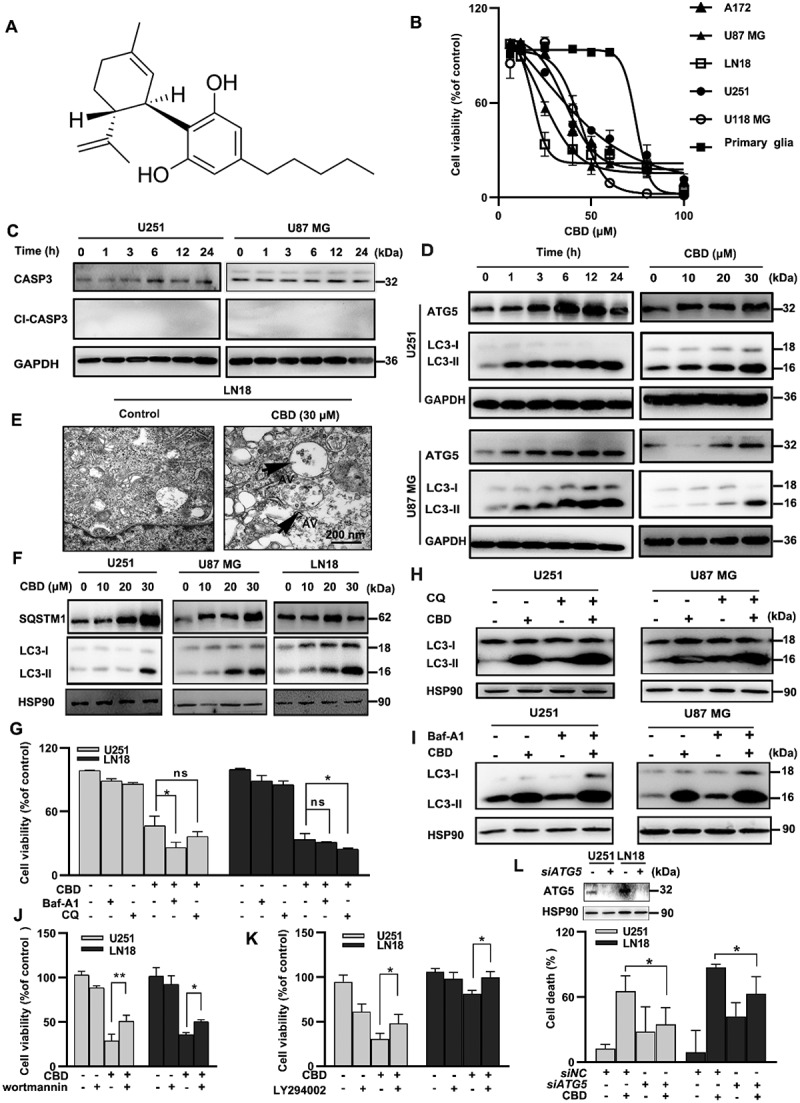
CBD induced lethal autophagy in glioma cells. (A) Molecular structure of CBD. (B) Growth inhibition effect of CBD on A172, U87 MG, LN18, U251, U118 MG and primary glia cells. Cell viability was measured by MTT after 72 h of CBD treatment. (C) Effect of CBD treatment on CASP3 cleavage in glioma cells. Cells were treated with 30 µM CBD for different times and subjected to western blotting. (D) Effect of CBD treatment on autophagy related proteins. Cells were treated with 30 µM CBD for different times (left) or different concentrations for 24 h (right); LC3 and ATG5 levels were analyzed by western blotting. (E) Ultrastructural features of LN18 cells treated with 30 µM CBD for 24 h were analyzed by electron microscopy. Arrows indicate autophagosomes. Scale bar: 2 µm. (F) Effect of CBD treatment on SQSTM1 protein levels in glioma cells. Cells were treated with different concentrations of CBD for 24 h; SQSTM1 and LC3 levels were analyzed by western blotting. (G) Effect of autophagy inhibitors CQ and Baf-A1 on CBD-induced growth inhibition in glioma cells. U251 and LN18 cells were treated with CBD (20 μM for 48 h) alone or in combination with Baf-A1 (100 nM) or CQ (20 μM); cell number was determined by MTT. (H-I) Effect of autophagy inhibitors CQ and Baf-A1 on CBD-induced LC3 expression in glioma cells. Cells were pre-treated with CQ or Baf-A1 for 1 h and then treated with 20 µM CBD for another 24 h; LC3 levels were analyzed by western blotting. (J-K) Effect of autophagy inhibitors wortmannin and LY294002 on CBD-induced cell death in glioma cells. Cells were pretreated with wortmannin (20 μM, J) or LY294002 (5 μM, K) for 1 h and then treated with CBD (20 μM) for 48 h, cell viability was determined by MTT. (L) Effect of ATG5 knockdown on CBD-induced cell death in glioma cells. Cells were transfected with control or ATG5 siRNA for 48 h, followed by treatment with 20 μM CBD for another 48 h, cell viability was determined by MTT. Data are shown as mean ± S.D. and are representative of three independent experiments. *P < 0.05; **P < 0.01