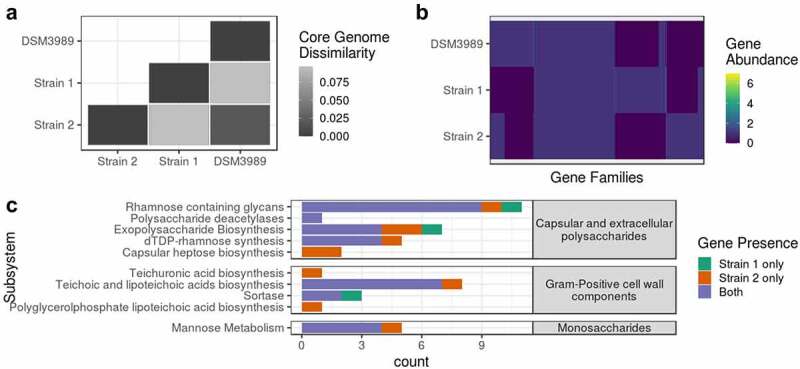
Figure 4.

Genomic differences in Holdemanella isolates. Genome sequencing of Holdemanella isolates revealed heterogeneity. The cophenetic distance matrix for the persistent genome alignment is given in Panel A. Dissimilarity is shown as FastTree’s adjusted estimate of protein similarity as scored by BLOSUM45. Panel B is a heatmap that depicts the variation in abundance of gene families (n = 3753) by strain. Panel C compares the presence of genes involved in cell membrane and wall biosynthesis as well as mannose metabolism in both isolates
