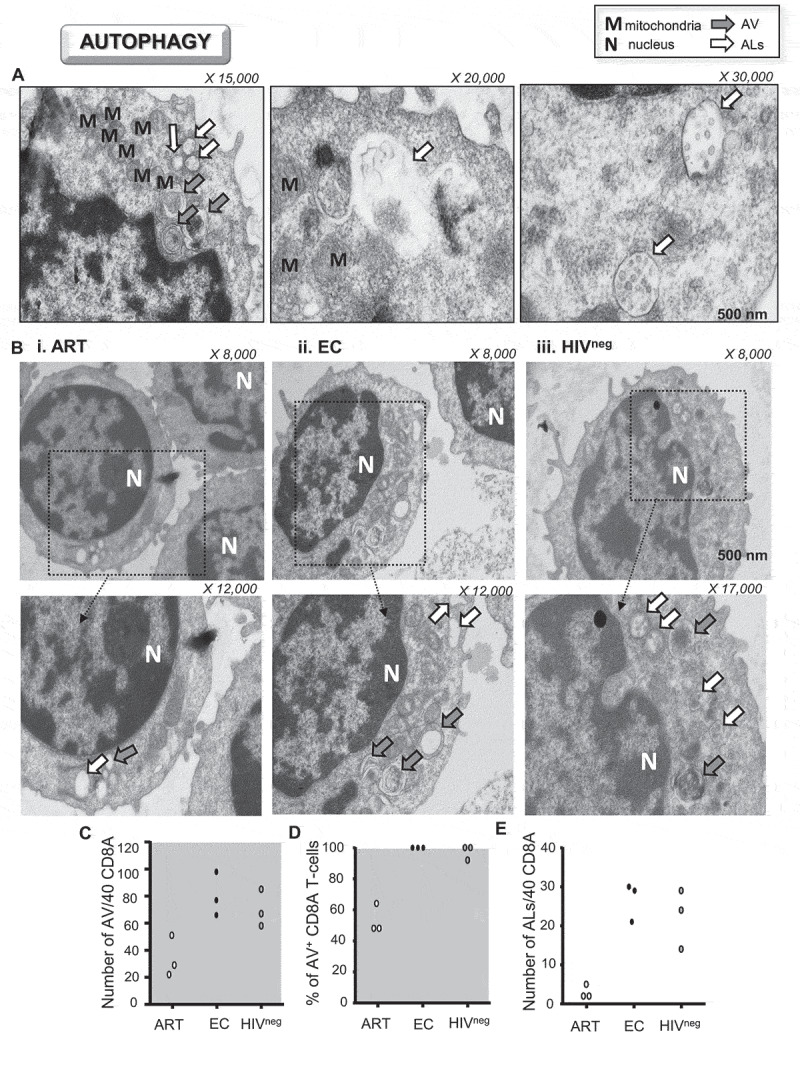
Figure 2.

Lower amounts of ALs in activated CD8A T-cells from ART. (A-E) Ultrastructural analysis of purified CD8A T-cells from ART, EC and HIVneg after 6 h of polyclonal activation (n = 3). (A) Representative ultrastructural micrographs from uninfected controls to differentiate AV (autophagic vacuoles; gray arrows) from ALs (autolysosomes; white arrows). (B) Ultrastructural micrographs in i. ART, ii. EC and iii. HIVneg including strategic magnifications to appreciate the numbers of cellular vacuoles (X 8,000–17,000). Quantitative analysis of (C) the number and (D) percentages of positive CD8A T-cells for AV per 40 cells. (E) Number of ALs per 40 CD8A T-cells
