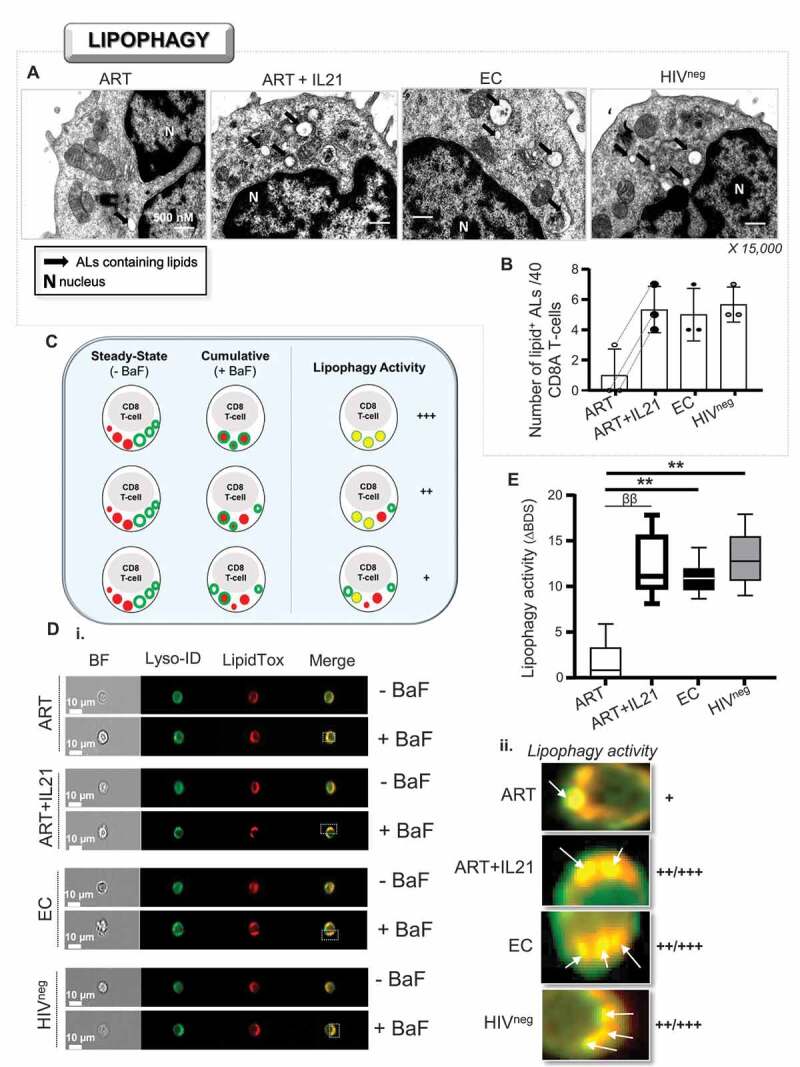
Figure 6.

Enhanced lipophagy in ART in response to IL21 treatment. (A and B) Visualization of ALs containing endogenous lipids using osmium tetroxide negative-staining in activated CD8A T-cells (n = 3). (A) Magnified images showing ALs containing lipids (black arrows) for all study groups including ART that have been treated or not with IL21 (15,000 X). (B) Quantitative analysis of the number of ALs containing lipids per 40 cells. (C-E) Assessment of lipophagy activity by using a novel ImageStream-based lipophagy assay (n = 6). (C) Schematic representation for assessing lipophagy activity. (D) i. Representative images of single Lyso-ID+LipidTox+ CD8A T-cells for all groups after 6 h of polyclonal activation in the presence or absence of BaF (“cumulative” and “steady-state” conditions, respectively). BF, bright field. ii. Magnified images showing increased lysosomal content of endogenous lipids in BaF-treated cells, which is an indicator of lipophagy activity when compared to cells without BaF. (E) Quantification of lipophagy activity determined in Lyso-ID+LipidTox+ CD8A T-cells in ART (with or without IL-21), EC and HIVneg. Lipophagy activity was determined by the formula: ΔBDS = (% of BDShigh cells with BaF) – (% of BDShigh cells without BaF). β, symbol used for paired t test (comparison between treated CD8A T-cells and their untreated control). *, symbol used for Mann-Whitney test (comparison between study groups). One symbol, 0.05 > P> 0.01; two symbols, 0.01 > P> 0.001; and three symbols, 0.001 > P> 0.0001
