
Figure 3.
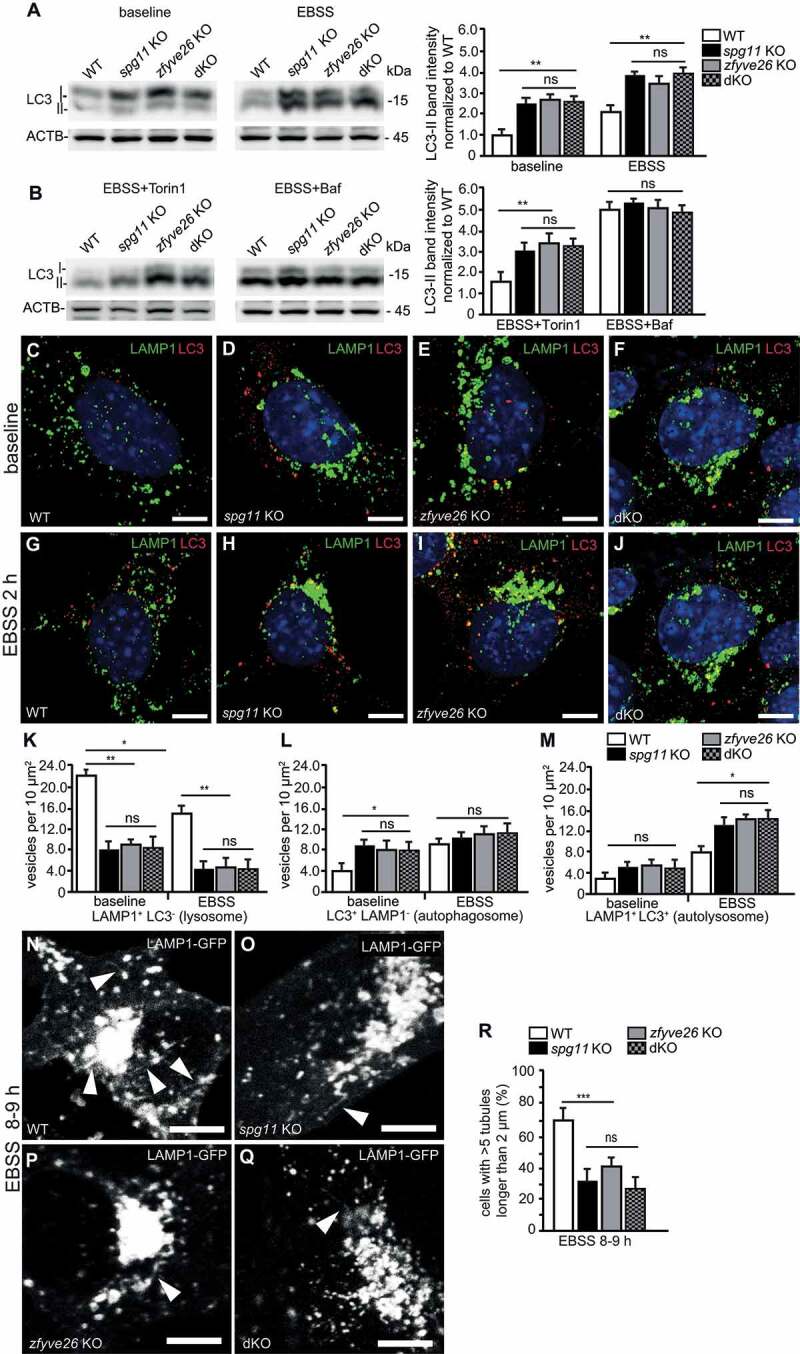
Autophagic lysosome reformation is compromised in spg11 KO, zfyve26 KO and spg11 zfyve26 double KO (dKO) mouse embryonic fibroblasts. (A and B) Defective autophagy in spg11 KO, zfyve26 KO and dKO mouse embryonic fibroblasts (MEFs). Semi-quantitative western blotting analysis of LC3 abundance in WT, spg11 KO, zfyve26 KO and dKO MEFs at steady state and upon 6 h EBSS starvation with or without Torin1 or bafilomycin A1 (Baf). ACTB served as loading control. Normalization is relative to baseline WT (n = 3 experiments; one-way ANOVA followed by Tukey’s Multiple Comparison Test; * p < 0.05; ** p < 0.01; ns: not significant). (C-M) Autophagic flux is similarly compromised in spg11 KO, zfyve26 KO and dKO MEFs. LAMP1 (green) and LC3 (red) stainings of WT (C and G), spg11 KO (D and H), zfyve26 KO (E and I) and dKO (F and J) MEFs at baseline and after 2 h of EBSS starvation. Scale bars: 10 µm. (K-M) Quantification of lysosomes (K) defined as LAMP1-positive but LC3-negative puncta, autophagosomes (L) defined as LC3-positive but LAMP1-negative puncta, and autolysosomes (M) defined as LAMP1- and LC3-positive puncta (at least 30 cells per genotype from n = 3 experiments; one-way ANOVA followed by Tukey’s Multiple Comparison Test; ** p < 0.01; * p < 0.05; ns: not significant). (N-R) ALR is similarly compromised in spg11 KO, zfyve26 KO and dKO MEFs. Representative live cell imaging time frames of WT (N), spg11 KO (O), zfyve26 KO (P) and dKO (Q) MEFs between 8 and 9 h of EBSS starvation. LAMP1-positive tubules are marked by white arrowheads. Scale bars: 10 µm. (R) Quantification of cells with more than 5 LAMP1-positive tubules longer than 2 µm (at least 30 cells per genotype from n = 3 independent experiments; one-way ANOVA followed by Newman-Keuls Multiple Comparison Test; *** p < 0.001; ns: not significant). Error bars represent SEM