
Figure 6.
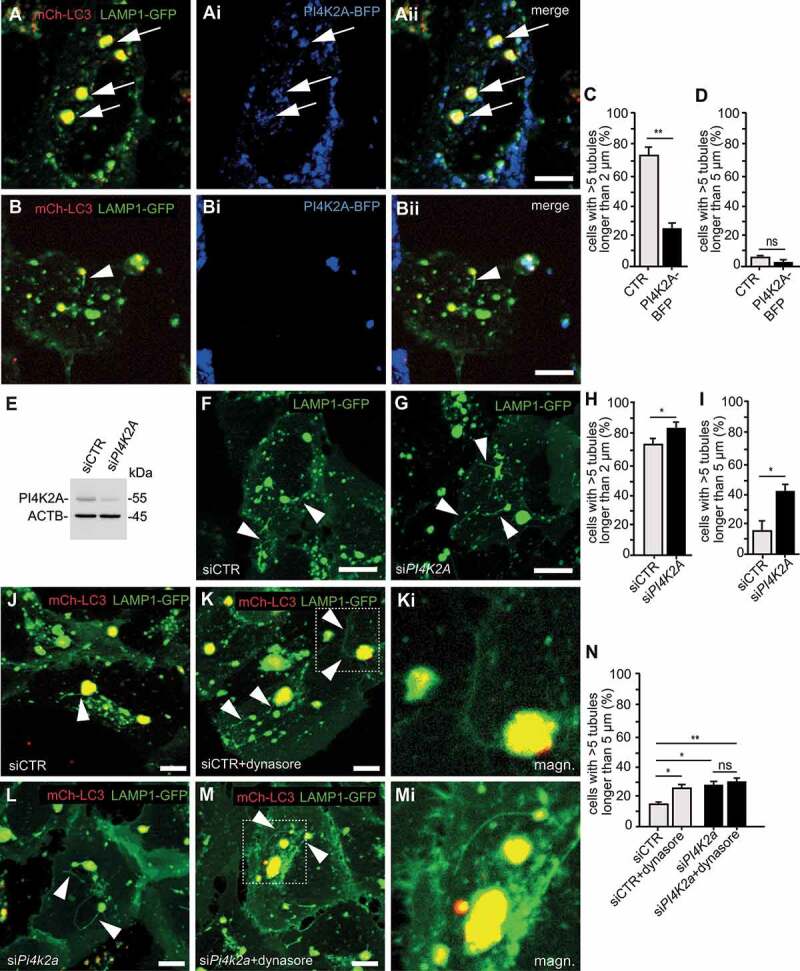
PI4K2A modulates autophagic lysosome reformation. (A-D) Overexpression of PI4K2A-BFP in U2-OS cells stably expressing LAMP1-GFP and mCherry-LC3 impairs ALR. Less tubulation of LAMP1-GFP (green) and mCherry-LC3 (red) labeled autolysosomes in a cell expressing PI4K2A-BFP (blue, marked with white arrows) (A-Aii) compared with a cell not expressing PI4K2A-BFP (B-Bii). Cells were starved with EBSS for 8–9 h. (C and D) Quantification of the ratio of cells with > 5 tubules longer than 2 µm or 5 µm in PI4K2A-BFP positive and negative (CTR) cells (at least 30 cells per group from n = 3 experiments; Student’s t-test: ** p < 0.01; ns: not significant). Scale bars: 10 µm. (E-I) SiRNA mediated knockdown of PI4K2A in U2-OS cells stably expressing LAMP1-GFP. (E) Immunoblot analysis of cells transfected with either scrambled siRNA (siCTR) or siRNA targeting PI4K2A (siPI4K2A) with ACTB as loading control. (F and G) Tubulation events (white arrowheads) in control (F) and knockdown (G) cells. Scale bars: 10 µm. (H and I) The ratio of cells with more than 5 LAMP1-positive tubules longer than 2 (H) or 5 µm (I) is increased upon knockdown of PI4K2A between 8 and 9 h of EBSS starvation (at least 30 cells per group from n = 3 experiments; Student’s t-test: * p < 0.05). (J-N) Inhibition of tubule scission with Dynasore resembles the tubulation defect observed upon knockdown of PI4K2A and does not aggravate the effect of PI4K2A knockdown on ALR (quantification of at least 30 cells per genotype from n = 3 independent experiments; one-way ANOVA followed by Newman-Keuls Multiple Comparison Test; *** p < 0.001; ns: not significant). Scale bars: 10 µm. Error bars represent SEM