
Figure 1.
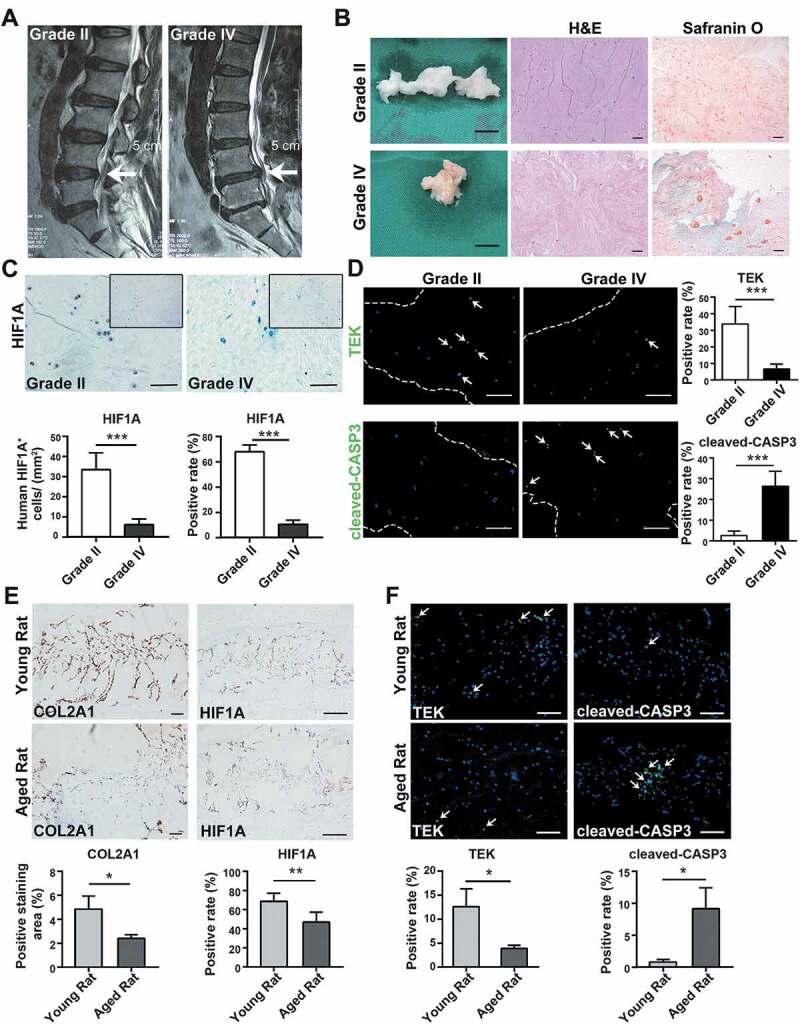
Alternations during the disc degeneration in humans and rats. (A) Typical human MR T2-weighted images of grade II (left panel) and grade IV (right panel) IVD. The degenerated discs were indicated by white arrows. Scale bar: 5 cm. (B) General view of nucleus pulposus from donors who accepted nucleus pulposus discectomy surgery; Scale bar: 1 cm. The H&E and Safranin O-Fast Green staining of nucleus pulposus from human degenerated disc were shown on the right. Scale bar: 200 μm. (C) IHC staining of HIF1A in human nucleus pulposus sections. Scale bar: 200 μm. Quantitative analysis of HIF1A was shown as cells/mm2 (left panel) and positive rate (right panel). (D) IF staining of TEK and cleaved-CASP3 in human nucleus pulposus sections, the nucleus was labeled with DAPI, the region of nucleus pulposus was framed by dotted lines, the positive staining cells were indicated by white arrowheads. Scale bar: 200 μm. The positive rate of TEK and cleaved-CASP3 was shown in the statistical chart. (E) IHC staining of HIF1A and COL2A1 (collagen type II alpha 1 chain) in young and aged rat tissue sections. Positively stained cells were in brown. Scale bar: 200 μm. The expression level of COL2A1 was shown as the percentage of positively stained area, while HIF1A was quantified as positive rate (right panel). (F) IF staining of TEK and cleaved-CASP3 in rat tissue sections. Scale bar: 200 μm. The positive rate of TEK and cleaved-CASP3 was shown. Results were shown as mean ± SD. P value was calculated with t-test. *p < 0.05, *p < 0.01, ***p < 0.001