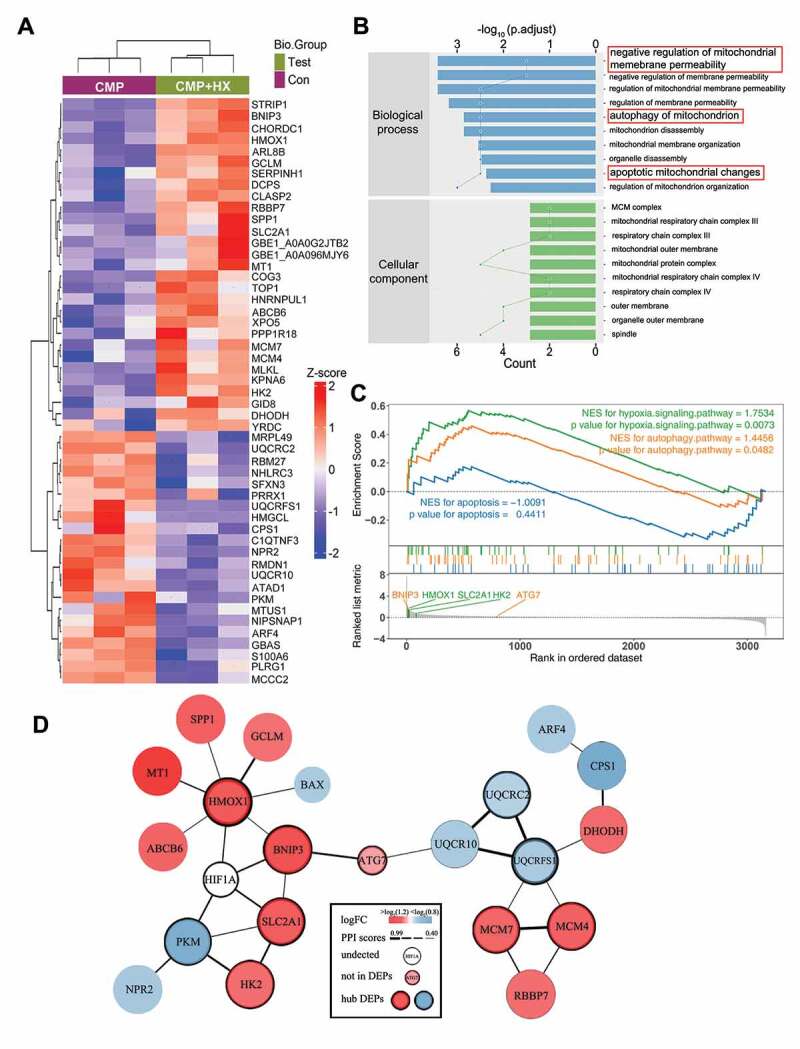
Figure 7.

Quantitative proteomic analysis reveals the proteins that mediate the autophagy-stimulating effect of HIF1A. (A) Heatmap depicting the expression profiling of the 51 DEPs in the comparison between CMP+HX and CMP group. (B) GO enrichment analysis (biological processes and cellular component) of DEPs illustrating the gene count (indicated by the lines) and the adjusted hypergeometric p values (indicated by the bars). (C) GSEA of the FC-ranked DEP list showing the normalized enriched scores (NES) and the Kolmogorov–Smirnov p values for each predefined KEGG gene sets. Several interested proteins shown in the ranked list metric part were highlighted with the color same as their correlated pathways. (D) The PPI networks for DEPs and several related proteins. ATG7 was proved significantly upregulated by hypoxia (Figure 5 G) but excluded from DEPs due to p > 0.05. The thickness of connecting lines indicated the PPI confidence scores (values>0.4) according to the database STRINGv11. Node colors indicated the logFC values of DEPs. Hub DEPs, ranking the top in the list of connection degree that was generated by the Cytoscape plugin cytoHubba, were shown in nodes with bold borders
