
Figure 9.
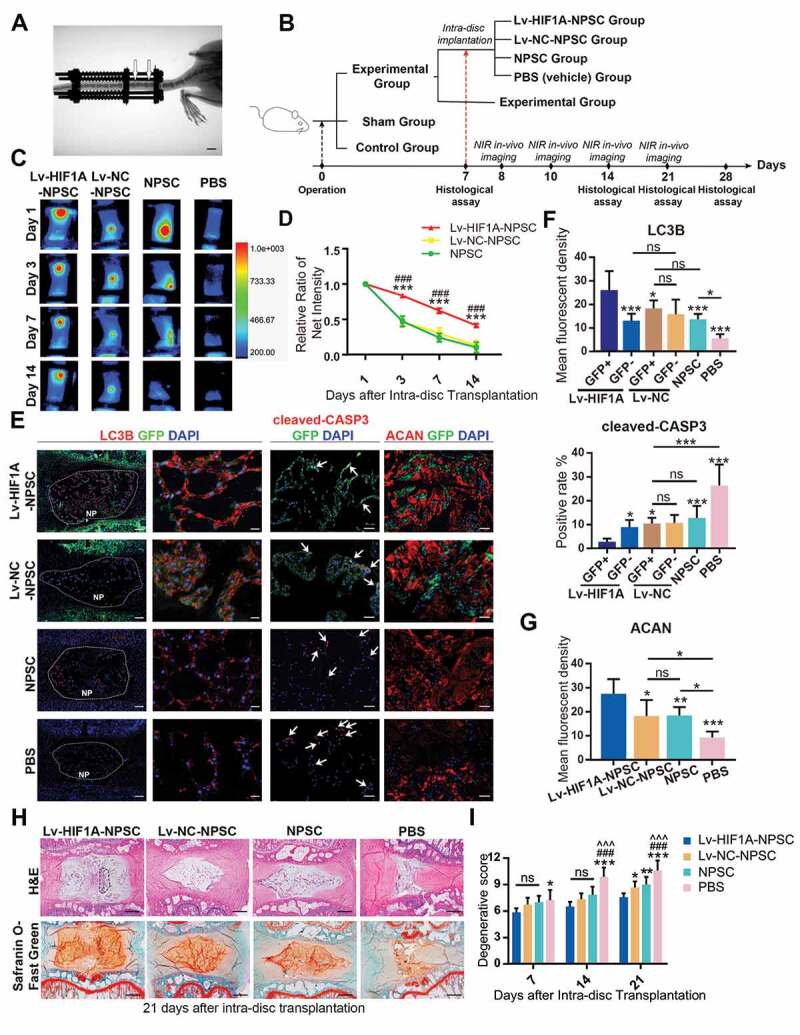
HIF1A overexpressed NPSCs retards IDD in vivo. (A) Typical image showing the rat IDD model, photographed by X-Ray after the operation. The white arrowheads indicated the compressed disc. Scale bar: 1 cm. (B) Schematic diagram explaining the workflow and the group settings of animal experiments. The IDD model rats on the 7th day post-surgery were randomly divided into five groups (n = 20 for each group). Near infra-red (NIR) in-vivo imaging was conducted for those underwent intra-disc transplantation. (C) NIR signals emitted from the transplanted cells were visualized at 1, 3, 7, and 14 days after intra-disc transplantation. The correlation between color and the intensity of the image was shown in the right panel. (D) The dynamics of the relative ratio of NIR net intensity (data aligned according to the 1st day image) of each group was shown in the statistical chart. Results were shown as mean ± SEM. ***, compared to the Lv-NC-NPSC group, p < 0.001; ###, compared to the NPSC group, p < 0.001. (E) IF staining of LC3B (The left panel: general view of disc sections for each group, the dotted lines indicated the border of NP, scale bar: 200 μm; Red: anti-LC3B. Green: anti-GFP. Blue: DAPI; The right panel: Representative images of LC3B staining, scale bar: 20 μm), cleaved-CASP3 (the positive cells were indicted by the white arrows, scale bar: 50 μm) and ACAN (scale bar: 50 μm) in the disc of each group. (F) The expression level of LC3B and cleaved-CASP3 was shown in the statistical chart. Implanted NPSC (GFP+) and host cells (GFP−) were respectively analyzed. For the statistical charts from at least 3 independent experiments, results were shown as mean ± SD. ns, non-significant; *, compared to Lv-HIF1A-GFP+-NPSC group, *p < 0.05, **p < 0.01, ***p < 0.001. (G) The expression level of ACAN was shown in the statistical chart. ns, non-significant; *, compared to Lv-HIF1A-NPSC group, *p < 0.05, **p < 0.01, ***p < 0.001. (H) Representative pictures of H&E and Safranin O-Fast Green staining of each transplantation group at 21 days after transplantation. The black dotted lines showed the region of transplanted cells (upper right). Scale bar: 500 μm. (I) Histological degenerative scores at 7, 14, and 21 days after intra-disc transplantation. ns, non-significant; *, compared to Lv-HIF1A-NPSC group; #, compared to Lv-NC-NPSC group; ^, compared to the NPSC group. *p < 0.05; **p < 0.01; ###, ^^^, ***, p < 0.001