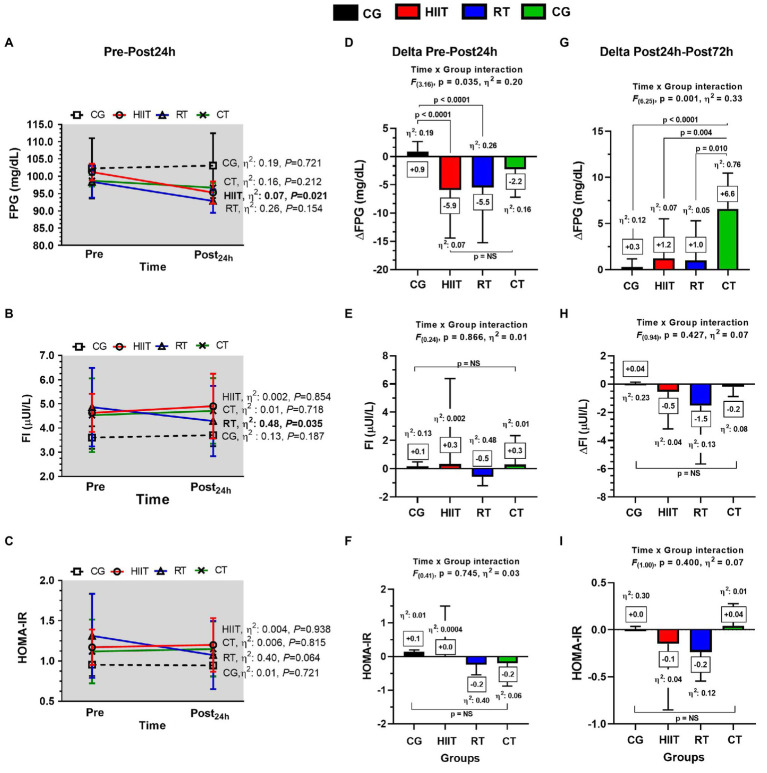
Figure 3.
Long-term (A-C) and acute post-24h (D-F) and post-72h changes (G-I) in metabolic outcomes in adult women with insulin resistance after 12-weeks of the three different exercise trainings or a control group. Panels (A-C) show values in mean±SEM during the exercise period. Panels (D–F) show values in “delta changes” (from pre- to post-24h). Panels (G–I) show values in “delta (Δ) changes” (from post-24h to post-72h). Groups are described as: control group (CG), high-intensity interval training (HIIT), resistance training (RT), and concurrent training (CT). Outcomes are described as: fasting plasma glucose (FPG), fasting insulin (FI), and homeostasis model assessment of insulin resistance (HOMA-IR). ∆FPG24h, ∆FI24h, and ∆HOMA-IR24h in panels (D–F), respectively, denote deltas from pre- to post-test 24h after the last exercise session. ∆FPG72h, ∆FI72h, and ∆HOMA-IR72h in panels (G–I), respectively, denote deltas from post-24h to post-72h after the last exercise session. Within-group changes are described with specific at values of p≤0.05 in bold in (A,D,G). Between-group changes are described in bold values in panels (D–I).

