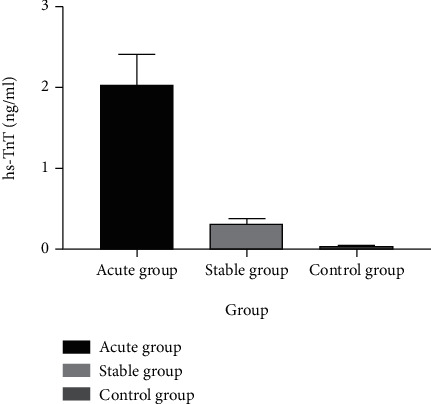
Figure 1.

Comparison of hs-TnT levels of three groups of experimental subjects. The abscissa represents the acute group, the stable group, and the control group, while the ordinate represents the hs-TnT level. As shown in Figure 1, the hs-TnT level was the highest in the acute group and the lowest in the control group. hs-TnT: hypersensitive troponin T.
