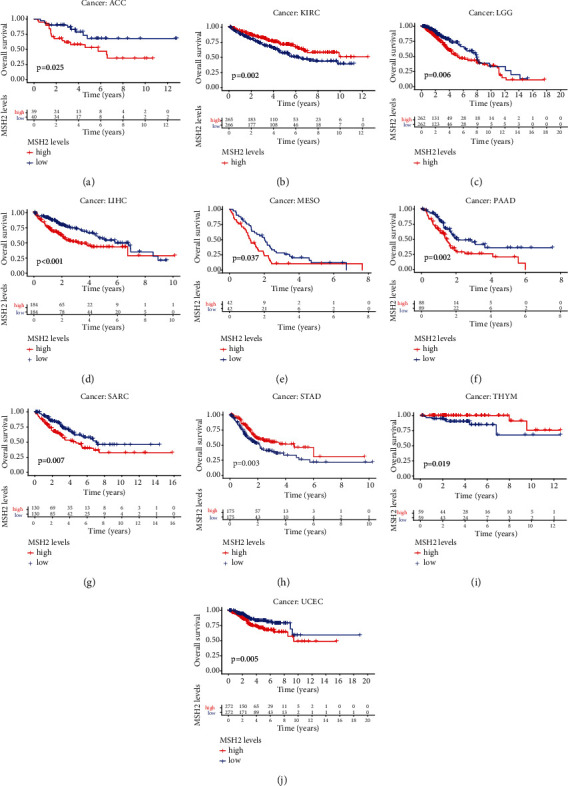
Figure 3.

Kaplan-Meier OS curves of MSH2 expression in the ten most significantly associated tumors. (a) KM curves of high and low MSH2 expression in ACC patients. (b) KM curves of high and low MSH2 expression in KIRC patients. (c) KM curves of high and low MSH2 expression in LGG patients. (d) KM curves of high and low MSH2 expression in LIHC patients. (e) KM curves of high and low MSH2 expression in MESO patients. (f) KM curves of high and low MSH2 expression in PAAD patients. (g) KM curves of high and low MSH2 expression in SARC patients. (h) KM curves of high and low MSH2 expression in STAD patients. (i) KM curves of high and low MSH2 expression in THYM patients. (j) KM curves of high and low MSH2 expression in UCEC patients.
