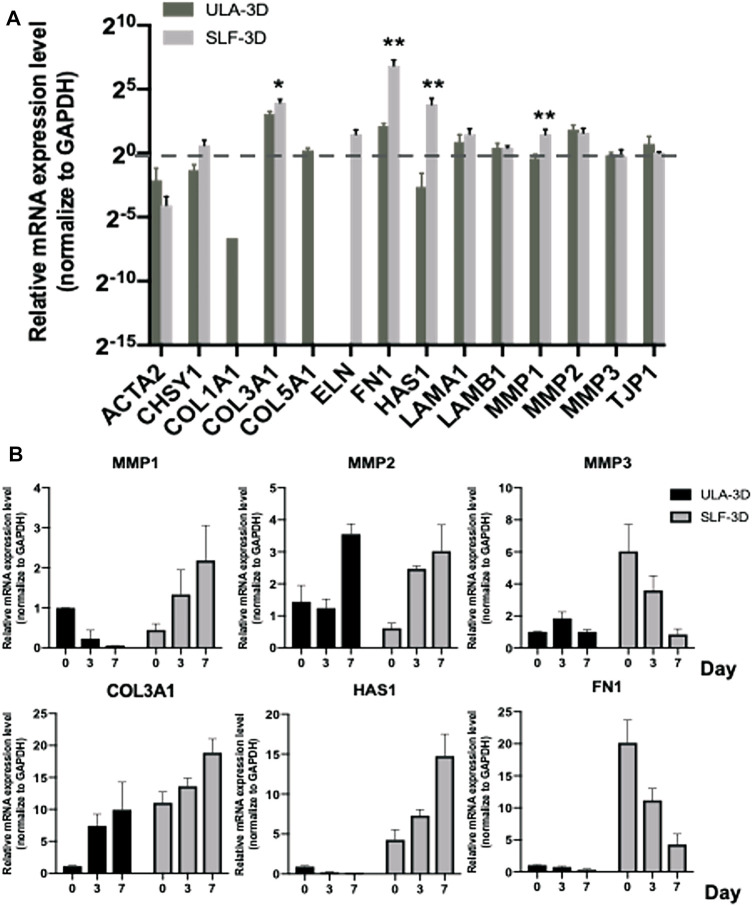
FIGURE 7.
ECM-related gene expression level of SLF-3D and ULA-3D spheroid. (A) ECM-related gene expression changes were evaluated by quantifying the mRNA level at 7 days in SLF-3D and ULA-3D ASC spheroids. (B) Spheroids were generated from SLF-3D and ULA-3D ASC spheroids at 0 days (12 h), 3 days, or 7 days and used for qPCR assay. Graphs show the means of three independent experiments, each performed in duplicate ±SE. n = 3; **p < 0.01.

