FIGURE 2.
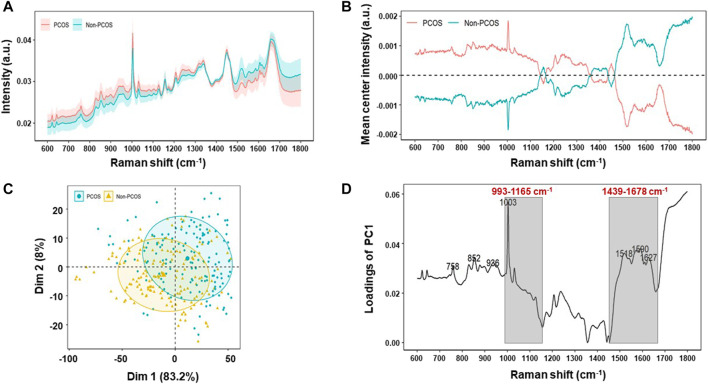
Raman profiling of follicular fluid of PCOS and non-PCOS. (A) Averaged Raman spectra of follicular fluid of PCOS (n = 150) and non-PCOS (n = 150) patients. Shaded areas represent the standard deviations. (B) Mean-centered Raman spectra differences between PCOS and non-PCOS groups by subtracting means from all samples. (C) Principal component analysis (PCA) of all Raman Spectra to show the clustering of PCOS and non-PCOS groups. (D) Raman wavenumber loading plots of contributions along dimension 1 of the PCA, where grey boxes indicate the two Raman zones responsible for the most significant variances between the two groups by comparing the quantified spectral intensity values.

