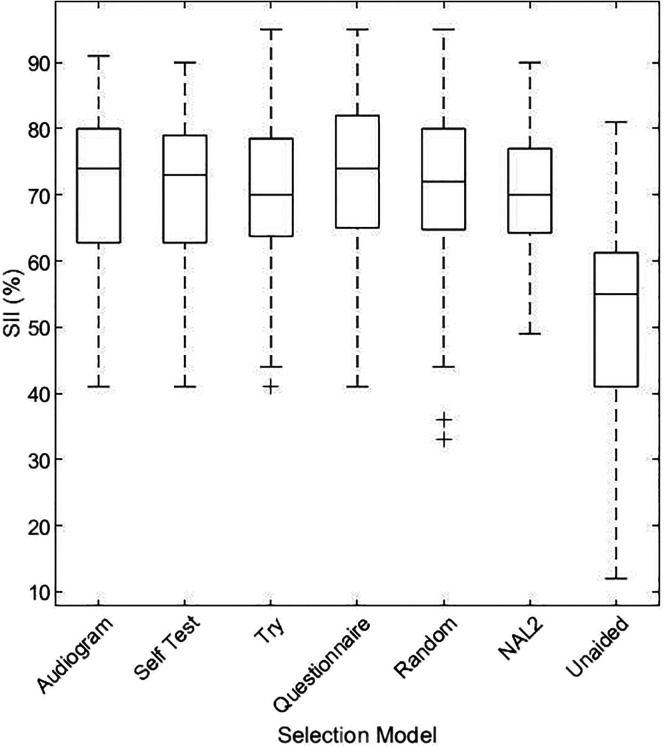
Figure 7.
Box plots of better-ear Speech Intelligibility Index (SII) measure for each selection model, the verified National Acoustic Laboratories–Non-Linear 2 (NAL-NL2) condition, and the unaided condition. The boundaries of the box represent the 25th and 75th percentiles, and the line inside the box represents the median. Error bars indicate the 10th and 90th percentiles. Plus signs represent outliers beyond the bounds of the error bars. Audiogram = select-by-audiogram; Self Test = select-by-self-test; Try= select-by-trying; Questionnaire = select-by-questionnaire; Random = select-by-random-assignment; NAL2 = the custom-programmed NAL-NL2 condition; Target = NAL-NL2 prescriptive target.

 This work is licensed under a