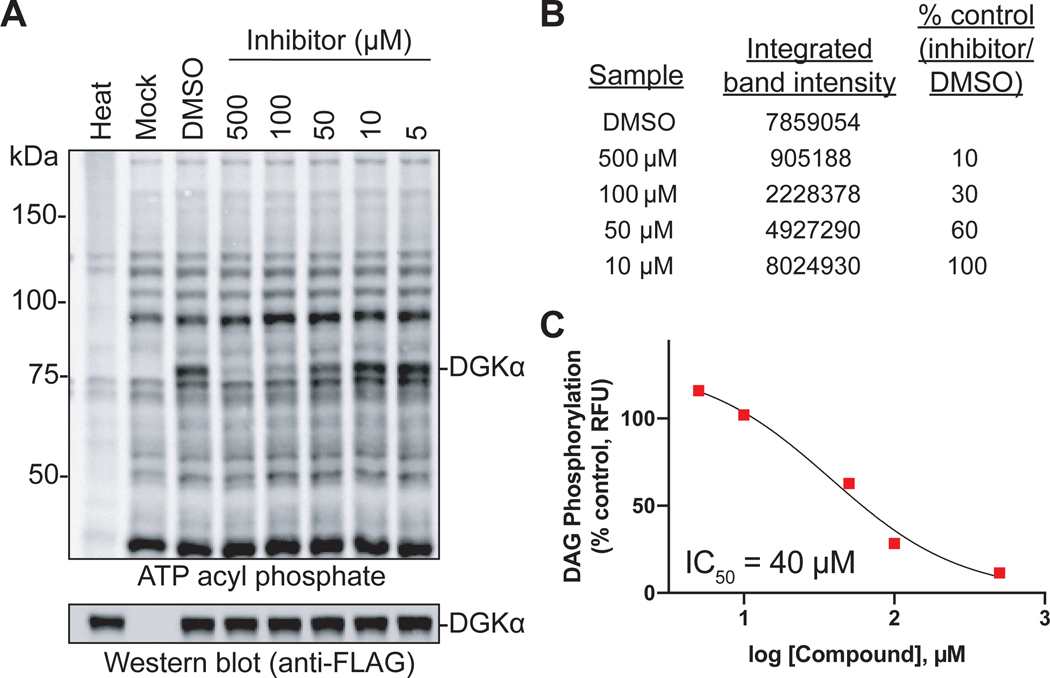
Figure 3. Example of data generated from gel-based chemical proteomic assay.
(A) In-gel fluorescent image of HEK293T cell lysates transiently expressing DGKα protein (~80 kDa; refer to Western blot for total expression level). Cell lysates were pre-treated for 30 minutes with vehicle (DMSO) or inhibitor (5 – 500 μM). Heat denatured control included to account for protein labeling that is not activity dependent. (B) DGKα band intensities were quantified using Bio-Rad Image Lab software, normalized to total protein, and the percent of control (DMSO) calculate(C) Nonlinear regression analysis was used to generate a dose-response curve for the inhibitor from percent control values using GraphPad Prism. IC50 value was quantified from dose-response curve.

