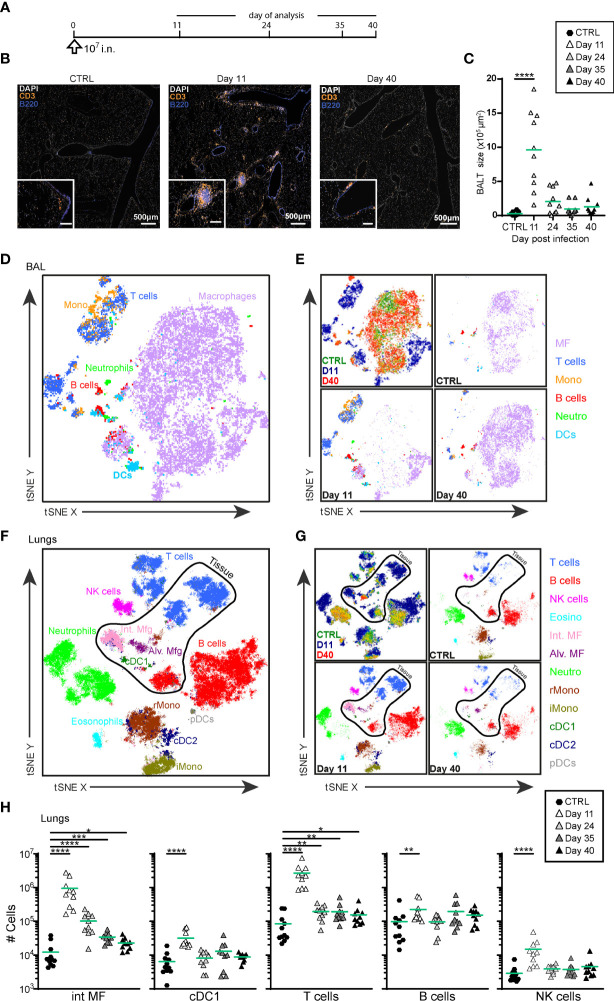
Figure 1.
Intranasal priming with MVA-SARS-2-S induces BALT and transient recruitment of T cells and macrophages in the lung. (A) Immunization protocol scheme. (B) Representative photomicrographs of lung sections reveal induction of BALT peaking at d11 after vaccine application. (C) Quantification of cumulative BALT size per lung section averaged on 3-4 lung sections per mouse. (D–G) Cellular composition of broncho-alveolar lavage (BAL; (D, E) and lung (F, G) analyzed by spectral flow cytometry and depicted as tSNE plot. Cluster identities were revealed by manual gating as shown in Supplementary Figures 1A, B ; antibodies used are listed in Supplementary Table S1 (panel 1). Cells inside the area delineated by the black line were negative for anti-CD45-FITC antibodies i.v injected 3 -5 min before mice were sacrificed and are thus considered to be from the lung parenchyma. Cells outside that area were CD45-FITC+ and considered to be within or in close vicinity to blood vessels. (D, F) Representative tSNE plot of concatenated samples from one mouse each sacrificed before (control) or 11 or 40 days after vaccine application; colors refer to indicated cell populations; antibodies used are listed in Supplementary Table S1 (panel 2). (E, G) Upper left, concatenated data as in (D, F), colors indicate different mice analyzed. Upper right and bottom plots: de-concatenated data, colors indicate cell populations. (H) Absolute cell numbers of interstitial macrophages (int MF), type 1 conventional dendritic cells (cDC1), NK, T and B cells in lung. (C, H) Pooled data from 3-4 experiments with n = 10 per group. (C, H) Individual values (symbols) and mean group value (lines). Statistical analysis was done on log-transformed values using ordinary or Welch’s ANOVA followed by Dunnett’s T3 multiple comparisons test. *p < 0.05, **p < 0.01, ***p < 0.001, ****p < 0.0001.

