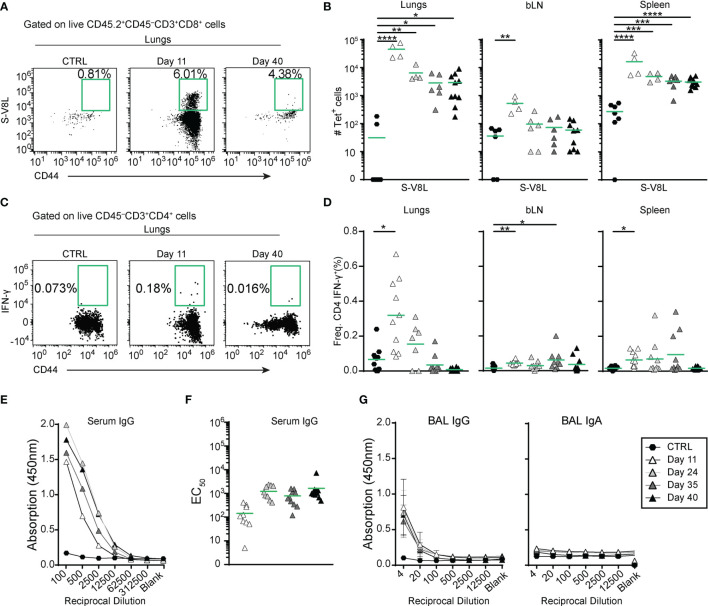
Figure 2.
A single intranasal vaccine application induces local and systemic spike-specific cellular and humoral responses. (A, B) Spike-specific CD8+ T cells accumulate in in the organs at different time points after vaccine application. (A) Representative dot plots and percentage of tetramer+ lung CD8+CD44hi T cells in groups indicated. (B) Absolute cell counts of spike-specific CD8+CD44hi T cells in different organs. (C, D) Spike-specific CD4+ T cells transiently accumulate in lungs and spleens up to day 35 after immunization. (C) Representative dot plots and percentages of IFN-γ-expressing lung CD8+CD44hi T cells of groups indicated after ex vivo re-stimulation with the pool of spike-specific and immnodominant peptides ( Supplementary Table S2 ) for 6hr. (D) Frequencies of IFN-γ-expressing CD4+CD44hi cells in different organs isolated from mice at indicated time points after i.n. vaccine administration. (E–G) Spike-specific antibodies in serum (E, F) and broncho-alveolar lavage fluid (BAL; (G) measured by ELISA. (E) Mean OD group values of serial serum dilutions and (F) and individual EC50 values for Spike-specific serum IgG for the groups indicated. (G) Mean group OD values in serial BAL dilutions for Spike-specific IgG (left) and IgA (right). (B, D, F) Pooled data from 3-4 experiments with n = 4-10 mice per group. Individual values (symbols) and mean group value (line). Statistical analysis was done on log-transformed values using ordinary or Welch’s ANOVA followed by Dunnett’s T3 multiple comparisons test. *p < 0.05, **p < 0.01, ***p < 0.001, ****p < 0.0001.

