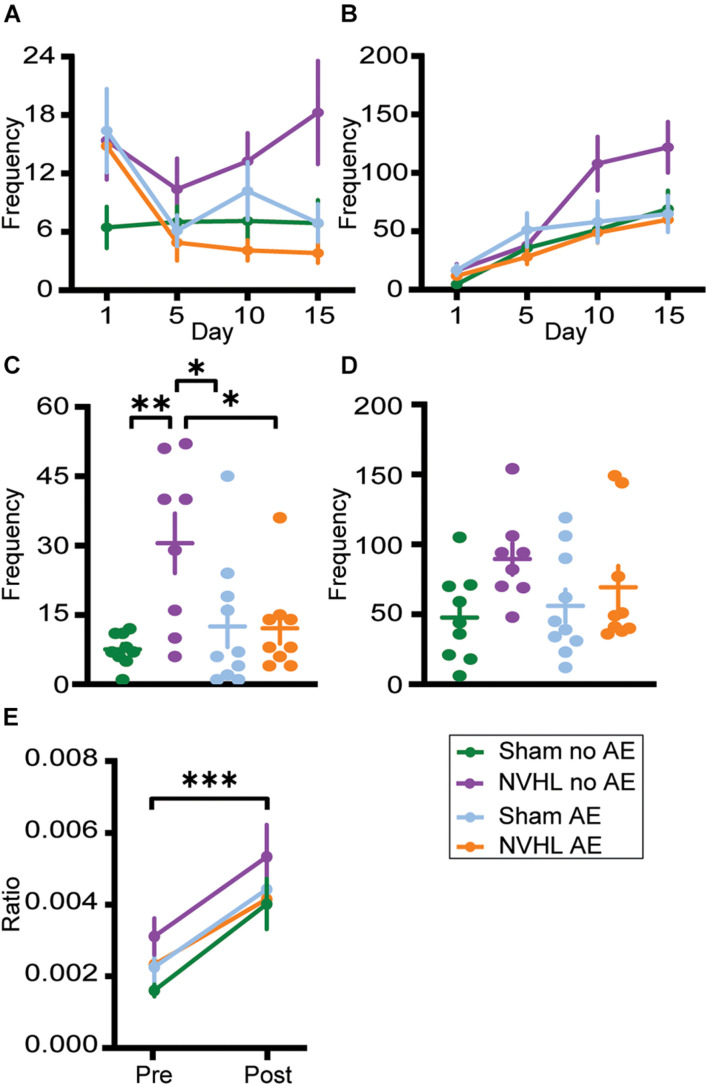
FIGURE 6.
Center zone frequency. (A) Frequency of center zone crosses before the injection of nicotine on days 1, 5, 10, and 15. (B) Frequency of center zone crosses after the injection of nicotine on days 1, 5, 10, and 15. No significant group differences were observed. (C) NVHL no AE rats had significantly increased frequency of center crosses during preinjection on the challenge day. (D) Following the nicotine injection on challenge day, no group differences were observed. (E) There was a significant increase in the ratio of frequency of center crosses to distance traveled following nicotine on the challenge day with no group differences. Data is shown as group mean ± SEM. ∗p ≤ 0.05; ∗∗p ≤ 0.01; and ∗∗∗p ≤ 0.001.

