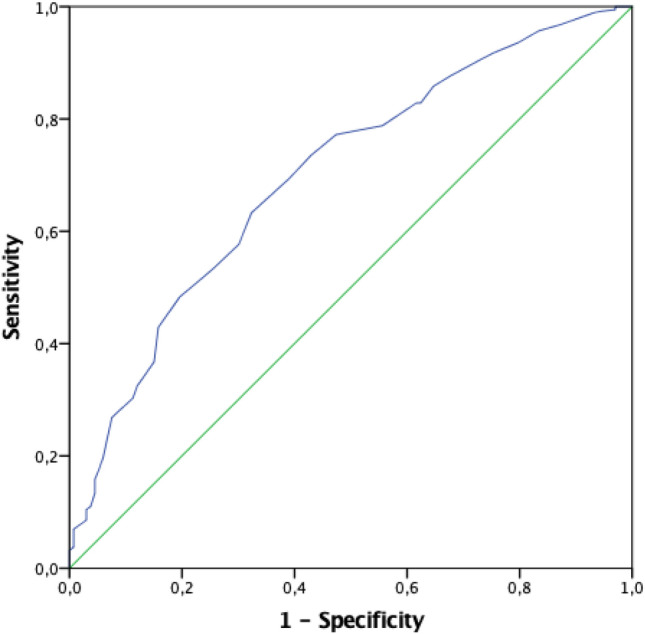
Fig. 3.

ROC curve analysis considering fT3 values according to patient outcome. The AUC was 0.702 (95%CI 0.649–0.751). A value of fT3 lower than 2.7 pmol/l (i.e. 2.65 pmol/l) shows a sensitivity of 69% and a specificity of 61%. Abbreviations: fT3, free triiodothyronine; AUC, area under the curve
