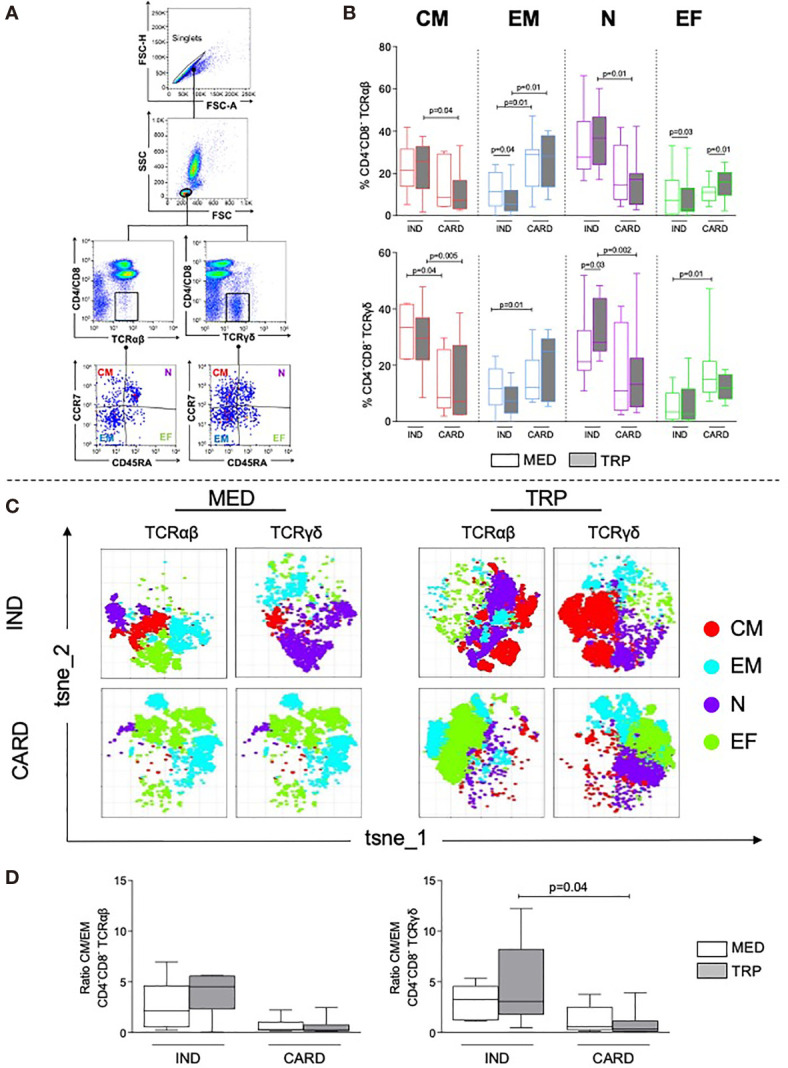
Figure 1.

Analysis of double-negative (DN) memory subpopulations, naive and effector cells in indeterminate (IND, n = 6) and cardiac (CARD, n = 6) Chagas patients. (A) Representative dot plots illustrating the selection of DN T-cell subpopulations after selection of singlets: central memory (CM), effector memory (EM), naive (N), and effector cells (EF). Representative plots were performed using data from one IND patient, in non-stimulated culture. (B) Frequencies of DN TCR αβ+ or γδ+ CM, EM, N, and EF cells before (MED) and after in vitro stimulation with live parasite (TRP). (C) t-SNE from combined data obtained from all IND and CARD patients using MED or TRP cultures, in TCR αβ+ or TCR γδ+ DN T cells. Colors correspond to phonograph-guided clustering. (D) Ratio of CM/EM DN T-cell memory subpopulations in IND and CARD, before (MED) and after in vitro stimulation with live parasite (TRP). Results in (B, D) are expressed as percentage in box plot, extending from the 25th to 75th percentile, with a horizontal line at the median with whiskers. Paired or unpaired t-tests were used to compare unstimulated and stimulated cultures or cultures between different groups of patients, respectively. Statistical significance is indicated in each graph.
