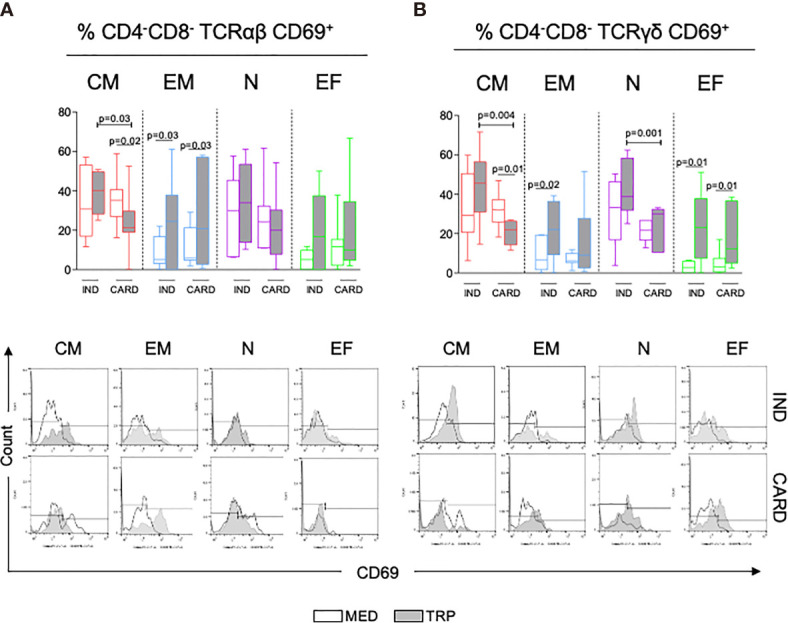
Figure 3.

Analysis of activation status of DN T-cell central (CM) and effector (EM) memory subpopulations, naive (N) and effector (EF) cells in indeterminate (IND, n = 6) and cardiac (CARD, n = 6) Chagas patients gauged by CD69 expression, before (MED) and after in vitro stimulation with live parasite (TRP). The graphs (A, B, top) represent the frequency of activated DN T-cell subpopulations in the different groups and under distinct conditions. The results are expressed as percentage in box plot, extending from the 25th to 75th percentile, with a horizontal line at the median with whiskers. Paired or unpaired t-tests were used to compare unstimulated and stimulated cultures or cultures between different groups of patients, respectively. Statistical significance is indicated in each graph. (A, B, bottom panels) Representative histograms of the expression of CD69 in the different DN T-cell subpopulations in IND and CARD. Clear curves show CD69 expresion in MED and gray curves show CD69 expression in TRP.
