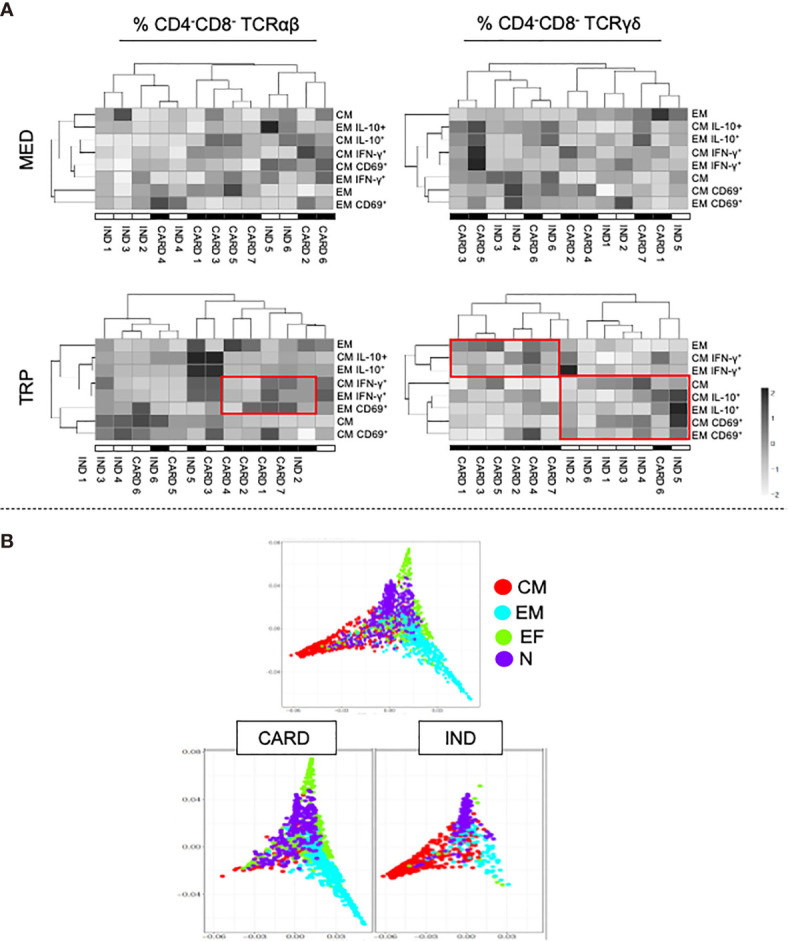
Figure 4.

Cluster heatmap analysis of activation marker (CD69) and cytokine expression (IFN-γ and IL-10) in DN T-cell subpopulations from indeterminate (IND) and cardiac (CARD) Chagas patients. (A) Top panels contain the cluster heatmap analysis of non-stimulated cultures (MED) and bottom panels contain the cluster heatmap analysis after in vitro stimulation with live parasite (TRP). The left panels show the distribution of TCR αβ DN T cells, and the right panels the TCR γδ DN T cells. (B) Difusion maps showing the trajectories and relationships of the different DN T-cell subpopulations. The top plots contain all patients grouped together and the bottom plots discriminate IND and CARD, showing distinct trajectories progressing toward EM and CM, respectively.
