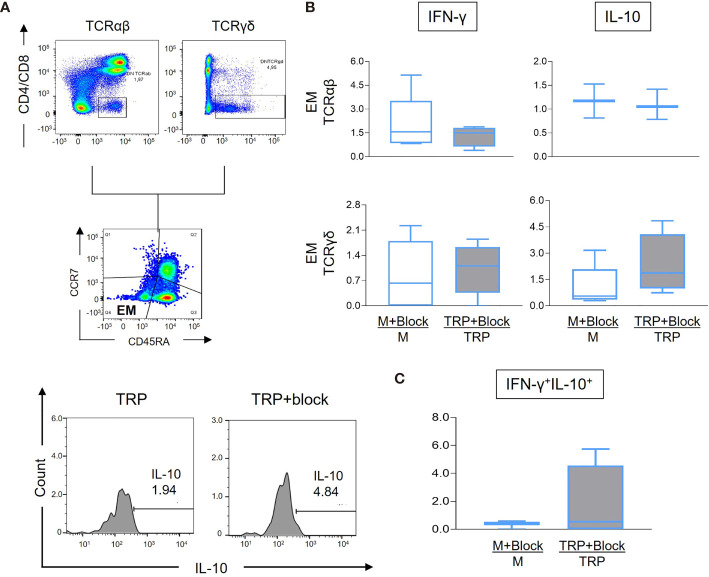
Figure 6.
Analysis of IFN-γ and IL-10 expression by effector memory (EM) DN T-cell subpopulations from cardiac Chagas patients (CARD, n = 4) before and after treatment with anti-CD1d monoclonal antibodies, as described in the Material and Methods. (A) Representative FACS plots showing the gating of CD4−CD8− TCR αβ+ or TCR γδ+ EM cells, followed by histograms of IL-10 expression measured in the presence of media alone (M), media plus anti-CD1d monoclonal antibody (M+block), parasite antigen alone (TRP-SA), or presence of TRP-SA plus anti-CD1d monoclonal antibody (TRP-SA+block). Representative plots were performed using data from one CARD patient, in stimulated culture. Histograms were from cultures stimulated and treated with blocking antibody. (B) Percent frequency of TCR αβ+ or TCR γδ+ EM DN T cells expressing IFN-γ and IL-10 as indicated. (C) Frequency of TCR γδ+ EM DN T cells co-expressing IFN-γ and IL-10. The results are expressed as percentage ratio for each culture condition (media+block/media or TRP-SA+block/TRP-SA) in box plots, extending from the 25th to 75th percentile, with a horizontal line at the median with whiskers. Paired t-tests were used to compare unstimulated and stimulated cultures. Statistical significance is indicated in the graph.

