. 2021 Nov 11;12:763323. doi: 10.3389/fimmu.2021.763323
Copyright © 2021 Honarmand Tamizkar, Gorji, Gholipour, Hussen, Mazdeh, Eslami, Taheri and Ghafouri-Fard
This is an open-access article distributed under the terms of the Creative Commons Attribution License (CC BY). The use, distribution or reproduction in other forums is permitted, provided the original author(s) and the copyright owner(s) are credited and that the original publication in this journal is cited, in accordance with accepted academic practice. No use, distribution or reproduction is permitted which does not comply with these terms.
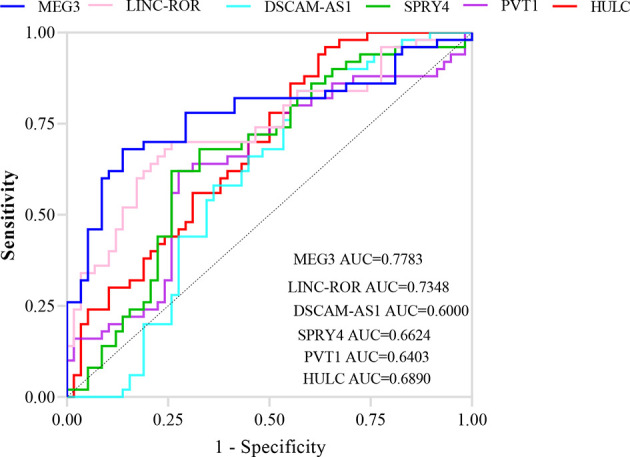
Figure 3.

ROC curves showing the power of lncRNAs in separation of PD patients from controls.
