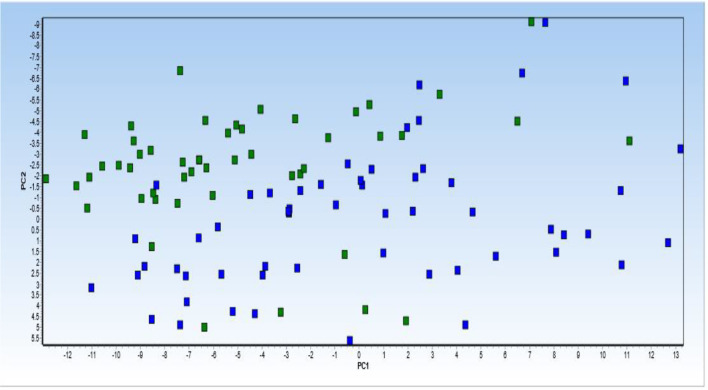
Figure 5.
Principal component analysis (PCA) of 6 lncRNA expression profiles in patients with Parkinson diseases compared with healthy control. PCA of the 6 lncRNAs expression data could not clearly clusters samples collected from healthy controls (blue squares) and patients with Parkinson (green squares) into their respective groups. Normalized values were used for principal component analysis.

