Figure 2.
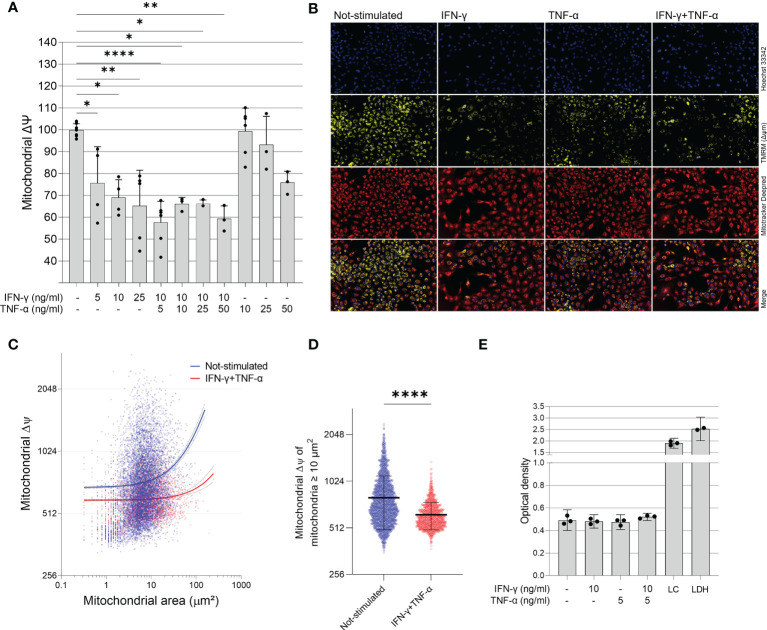
Effect of IFN-γ and TNF-α on mitochondrial membrane potential in human cardiomyocytes AC-16 cells. Stimulated cells were multi-labelled with TMRM, Mitotracker DeepRed, NucGreen and DAPI. TMRM fluorescence was measured when colocalized with the fluorescence of Mitotracker Deep Red in live cells (NucGreen-negative). (A) IFN-γ and IFN-γ plus TNF-α downmodulate ΔΨm 48h after stimulation. Data shown as percentage to not-stimulated cells. *p < 0.05; **p < 0.01; ****p < 0.0001; One-way Anova, Dunn’s post test. (B) Representative micrographs of the effect of IFN-γ (10 ng/ml), TNF-α (5 ng/ml) and both on the fluorescence of TMRM. Magnification 100x. (C) Correlation between size (µm2) and TMRM fluorescence intensity of segmented mitochondria of cells stimulated with 10 ng/ml of IFN-γ and 5 ng/ml of TNF-α. (D) ΔΨm of mitochondria larger ≥ 10 µm2 of cells stimulated with 10 ng/ml of IFN-γ and 5 ng/ml of TNF-α. ****p < 0.0001 Mann-Whitney test. (E) Supernatant quantification of lactate dehydrogenase (LDH assay) on stimulated cells. Each dot in bar graphs represents an independent experimental replicate n≥3. LC: lysed AC-16 cells; LDH: lactate dehydrogenase positive control.

