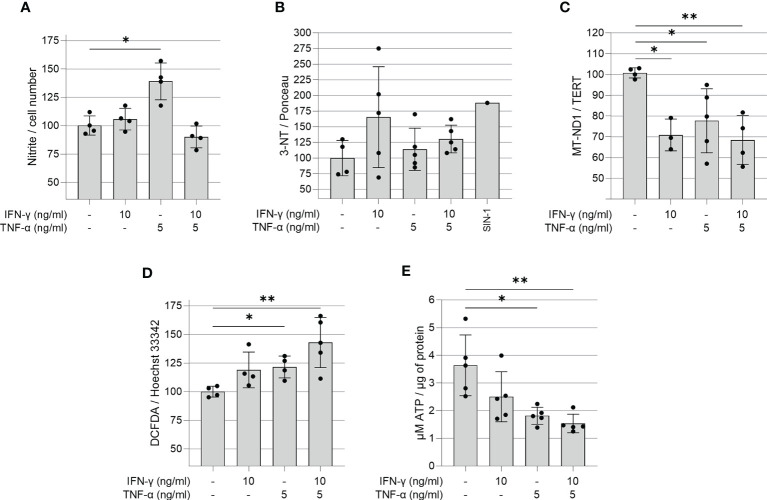
Figure 3.
Quantification of ROS, RNS, ATP and mitochondrial DNA in IFN-γ and TNF-α stimulated AC-16 cells. Human cardiomyocytes AC-16 cells were stimulated with 10 ng/ml of IFN-γ, 5 ng/ml of TNF-α or both for 48h. Then, cell lysates were used for the quantification of (A) nitrite (µM) by Griess Reaction; (B) 3-nitrotyrosine by dot blot; (C) copy number of the mitochondrial gene MT-ND1 by real time PCR; (D) cellular reactive oxygen species (ROS) by fluorescence assay using the probe DCFDA and (E) ATP by luciferase-based assay. Data are shown as percentage to not-stimulated cells in (A–D) *p < 0.05; **p < 0.01; one-way Anova Dunn’s post test. Each dot represents an independent experiment n≥3.

