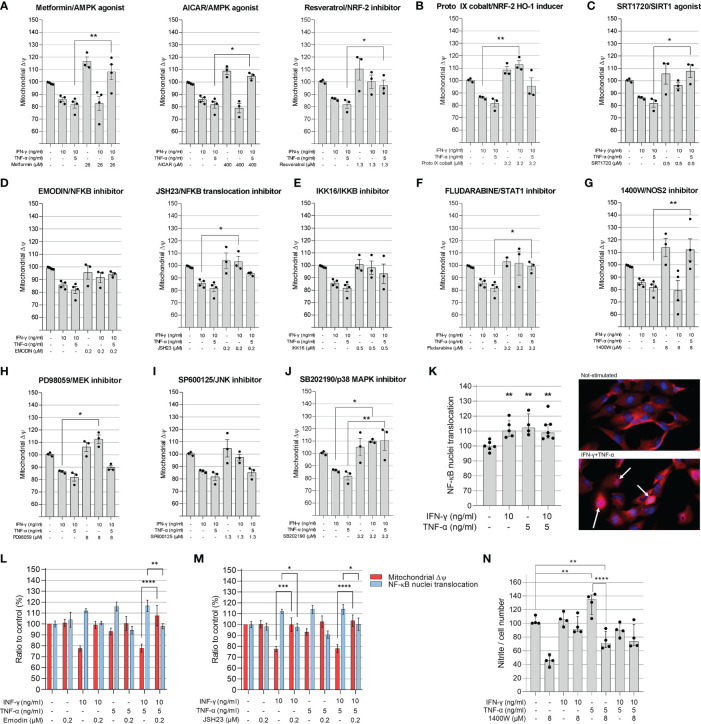
Figure 4.
Evaluation of compounds in the mitochondrial membrane potential of AC-16 cells. Selected doses of agonists of AMPK (A), NRF2 (B), SIRT1 (C) or inhibitors of NF-κB (D), IKKβ (E), STAT1 (F), NOS2 (G), MEK1 and MEK2 (H), JNK (I) and MAPK (J) were used alone or in combination with 10 ng/ml of IFN-γ or IFN-γ plus 5 ng/ml of TNF-α. Specific doses were selected based on the highest effect on mitochondrial ΔΨm and less than 10% loss on cell number. (K) The nuclear translocation of NF-κB in AC-16 cells was quantified by immunocytochemistry. Simultaneous measurement of ΔΨm and NF-κB translocation of cells stimulated with 10 ng/ml of IFN-γ or IFN-γ plus 5 ng/ml of TNF-α in combination with the NF-κB inhibitors (L) emodin and (M) JSH23. Statistics shown only when both ΔΨm and NF-κB translocation were significant. (N) the amount of nitrite (µM) in conditioned medium was measured by Griess reaction of cells stimulated with 10 ng/ml of IFN-γ or IFN-γ plus 5 ng/ml of TNF-α in combination with NOS2 inhibitor 1400W. Micrographs of NF-κB stains in the nucleus (white arrow). All data are shown as percentage to not-stimulated cells. Standard deviation is from ≥3 independent experiments. *p < 0.05; **p < 0.01; ****p < 0.0001 one-way Anova Dunn’s post test.

