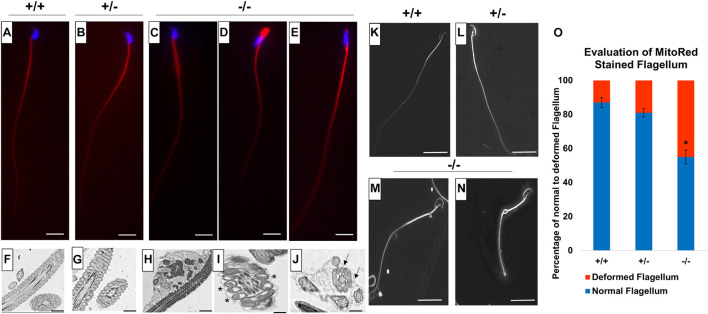
FIGURE 12.
Flagellum analysis on mature sperm cells from Pfn3+/+, Pfn3+/–, and Pfn3–/– mice. Mito Red staining (red) of sperm flagellum on (A) Pfn3+/+; (B) Pfn3+/–; and (C–E) Pfn3–/– sperm cells isolated from cauda epididymis. Scale bar = 10 μm. Ultrastructural analysis using TEM on (F) Pfn3+/+; (G) Pfn3+/–; and (H–J) Pfn3–/– sperm cells isolated from cauda epididymis. Vacuolated mitochondria are shown by asterisk, and fibrous sheet that contained more than one axoneme–mitochondrial complex is shown by arrows. Scale bar = 5 μm. Surface analysis using SEM on (K) Pfn3+/+, (L) Pfn3+/–, and (M,N) Pfn3–/– mature sperm cells isolated from cauda epididymis. Scale bar = 50 μm. (O) Statistical analysis of Mito Red-stained flagellum of Pfn3+/+, Pfn3+/–, and Pfn3–/– sperm cells. Data is presented as mean ± SD using ANOVA (Tukey’s post hoc) (*p < 0.05).

