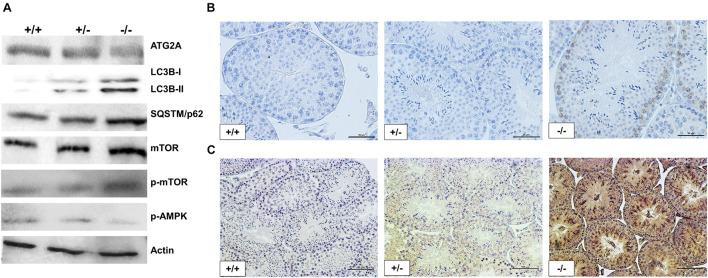
FIGURE 8.
Disruption in autophagic flux and AMPK/mTOR signaling pathway of Pfn3-deficient mice. (A) Immunoblot analysis against ATG2A, LC3B, SQSTM1, mTOR, phospho-mTOR, and phospho-AMPKα on protein lysates from Pfn3+/+, Pfn3+/–, and Pfn3–/– testes. (B) Immunohistochemical staining against phospho-mTOR on Pfn3+/+, Pfn3+/–, and Pfn3–/– testis sections (top row). (C) Immunohistochemical staining against LC3B on Pfn3+/+, Pfn3+/–, and Pfn3–/– testis sections (bottom row). Staining of testicular tissue sections from Pfn3+/+ (left column), Pfn3+/– (middle column), and Pfn3–/– (right column) animals is shown. Scale bar = 100 μm.

