Figure 2.
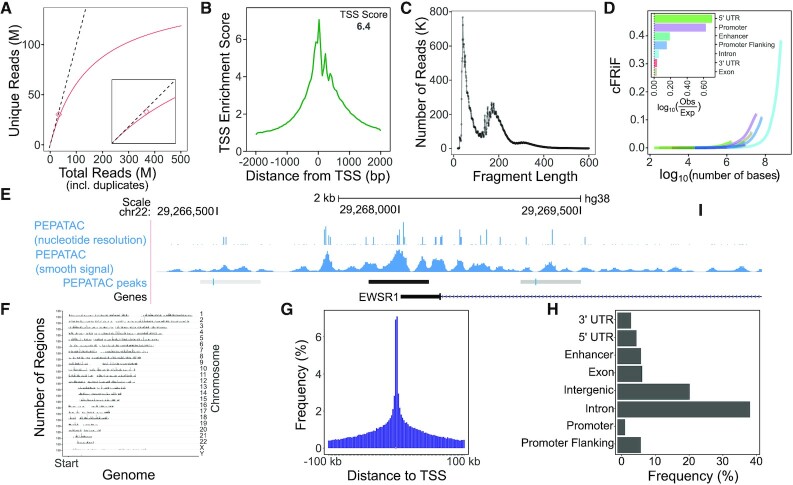
Example PEPATAC QC plots for reads and peaks. (A) Library complexity plots the read count versus externally calculated deduplicated read counts. Red line is library complexity curve for SRR5427743. Dashed line represents a completely unique library. Red diamond is the externally calculated duplicate read count. (B) TSS enrichment quality control plot. (C) Fragment length distribution showing characteristic peaks at mono-, di-, and tri-nucleosomes. (D) Cumulative fraction of reads in annotated genomic features (cFRiF). Inset: Fraction of reads in those features (FRiF). (E) Signal tracks including: nucleotide-resolution and smoothed signal tracks. PEPATAC default peaks are called using the default pipeline settings for MACS2 (32). (F) Distribution of peaks over the genome. (G) Distribution of peaks relative to TSS. (H) Distribution of peaks in annotated genomic partitions. Data from SRR5427743.

