Figure 2.
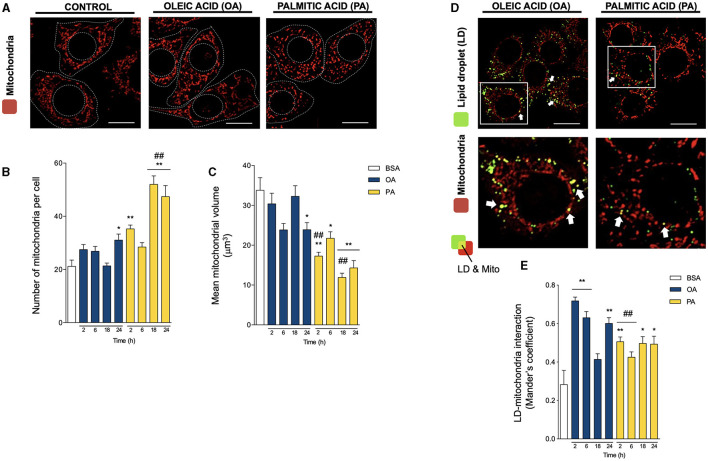
Oleic and palmitic acids differentially remodel mitochondrial morphology and their interaction with lipid droplets in HepG2 cells. (A) Representative confocal imaging of HepG2 cells treated with 200 μM of oleic acid (OA) or palmitic acid (PA) during 18 h and stained with MitoTracker Orange (red) for mitochondria visualization. Segmented lines represent the cellular and nuclear contours. Scale bar: 10 μm. (B) Quantification of the number of mitochondria per cell in images treated as in A for 0–24 h. (C) Mean individual mitochondrial volume of HepG2 cells treated as in A for 0–24 h. (D) Representative merged confocal imaging of HepG2 cells treated with 200 μM of OA or PA during 6 h and stained with Bodipy 493/503 (green) and MitoTracker Orange (red) for lipid droplet (LD) and mitochondria visualization, respectively. Colocalized areas are shown in yellow. White arrow marks spots of high colocalization. Scale bar: 10 μm. (E) Quantification of LD-mitochondria colocalization using Manders' coefficient for cell images obtained as described in D. Data are from N = 6–20 cells analyzed from three independent experiments. Scale bar: 10 μm. Results are shown as mean ± SEM; * p < 0.05; ** p < 0.01 vs. BSA; and ## p < 0.01 vs. OA at the same time conditions.

