Figure 1.
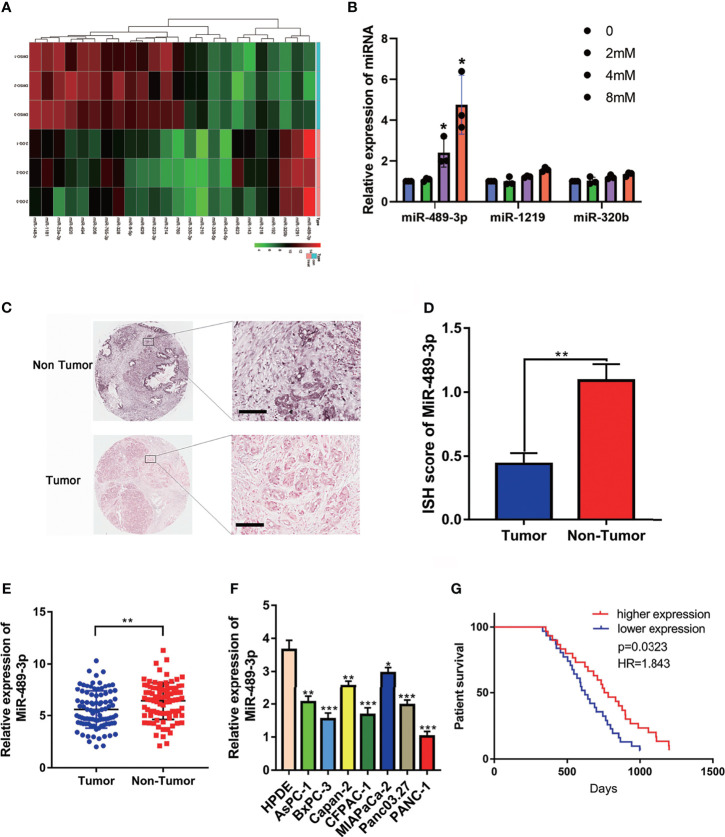
The expression of miR-489-3p and its relationship with clinical prognosis of patients. (A) RNA-seq analysis the different expressed miRNAs associated with glycolysis. (B) q-RT-PCR analysis the upregulated miRNA in the exposure with glycolysis inhibitor 2-DG. (C, D) RNA in situ hybridization experiments showed the expression of miR-489-3p in paracancerous and cancerous tissues. The bar stands for 50 microns (E) qRT-PCR analysis of the relative expression of miR-489-3p in adjacent tissues and PC tissues. (F) qRT-PCR showed the relative expression of miR-489-3p in PC cell lines and pancreatic normal duct epithelial cells (HPDE). (G) Kaplan-Meier curve was divided into survival periods by miR-489-3p expression. Among them, patients were divided into high expression group (red) and low expression group (blue) by median expression of miR-489-3p. (*P < 0.05, **P < 0.01, ***P < 0.001).

