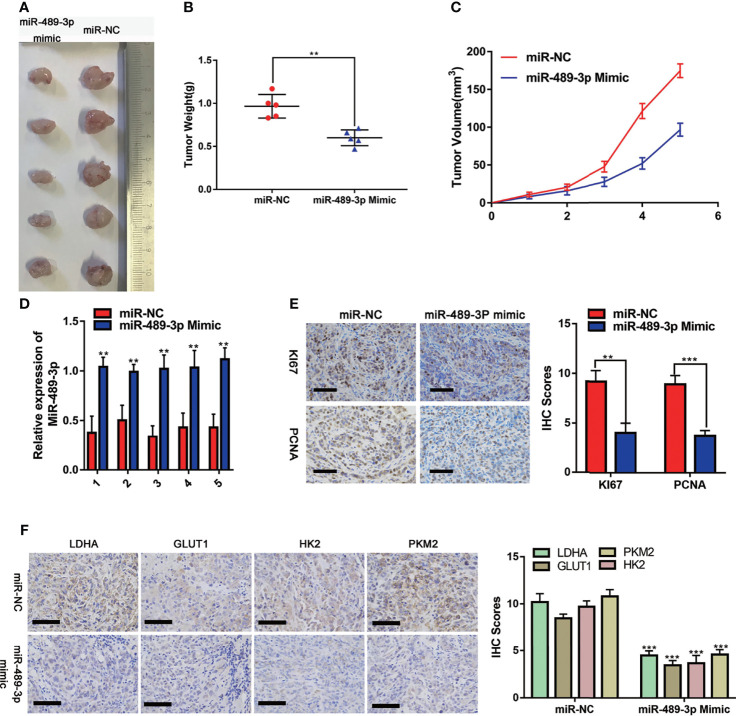
Figure 7.
Effects of overexpression of miR-489-3P on PC proliferation and metabolism in vivo. (A) Typical images of nude mice tumors (n = 5), (B) subcutaneous tumor weight, (C) subcutaneous tumor volume, (D) miR-489-3p expression in xenografts by qRT-PCR. (E) Typical IHC staining images of xenografts show Ki-67 and PCNA expression. The bar stands for 50 microns. (F) Typical IHC staining images of xenografts show the expression of metabolic indicators (LDHA, GLUT1, HK2, PKM2). The bar stands for 100 microns. (**P < 0.01, ***P < 0.001).

