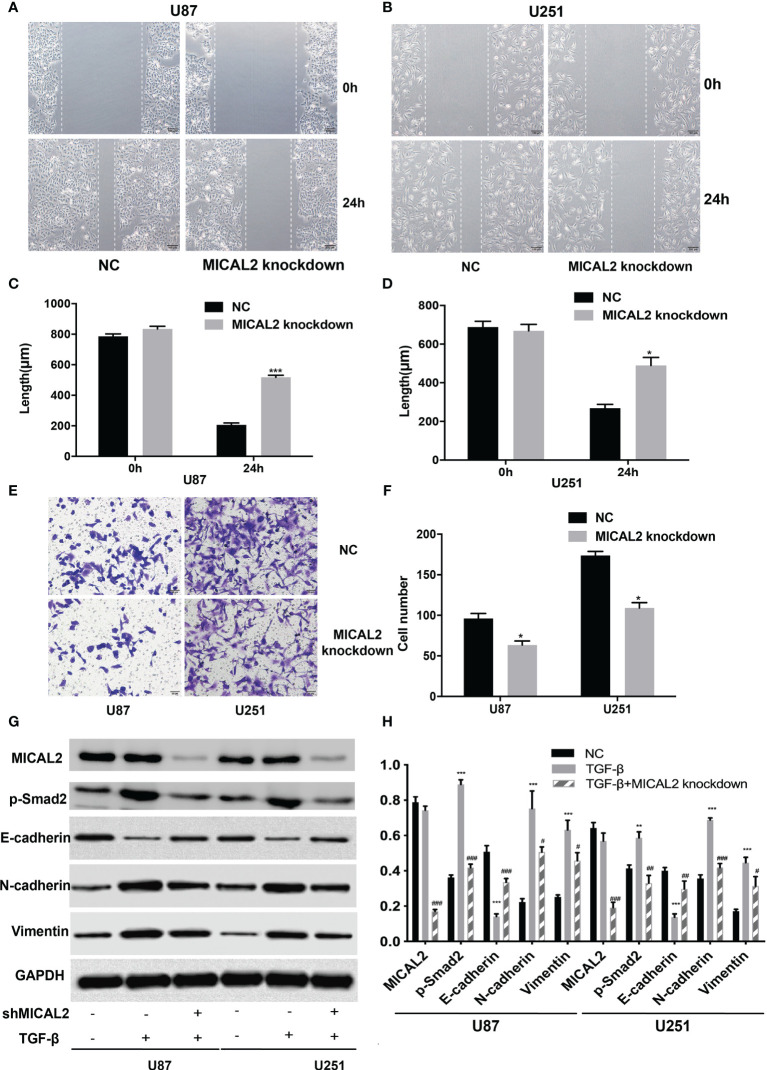
Figure 4.
Downregulation of TGFRI supressess migration and invasion of glioma cells. (A–D) The effect of TGFRI on cell migration was determined via wound-healing assay. Comparing with the NC group, the length of wound in TGFRI knockdown group in U87 (p < 0.001) and U251 (p < 0.05) were significantly higher after 24 h of healing. (E, F) Transwell migration assay was used to detect cell invasion ability of GBM cells. Cell number of TGFRI knockdown group were decreased in U87 (p < 0.05) and U251 (p < 0.05) cell lines compared with the NC group. (G, H) TGFRI, p-Smad2, and EMT relative protein (E-cadherin, N-cadherin, and vimentin) expression were detected via Western blotting. Data are shown as the means ± SEM of three experiments.Asterisk represents TGF-β-induced group comparing with the NC group; number sign represents TGF-β-induced and TGFRI-knockdown group comparing with the TGF-β-induced group; *,# p < 0.05, **,## p < 0.01, ***,### p < 0.001.

