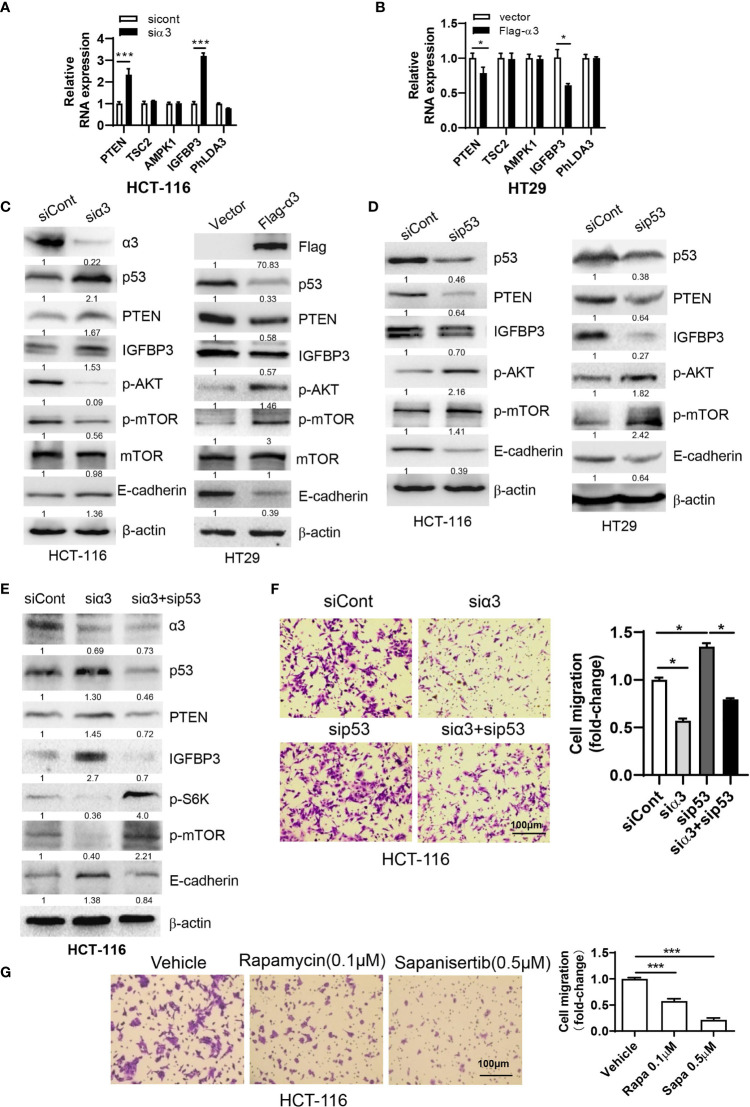
Figure 2.
α3 promotes CRC cell migration via p53-PTEN/IGFBP3-mediated mTOR. (A, B) The mRNA expression levels of p53 downstream targets PTEN, TSC2, AMPK1, IGFBP3 and PhLDA3 were analyzed by qPCR in HCT-116 cells after knockdown of α3 for 48 h (A) or in HT29 cells upon overexpression of α3 for 48 h (B). (C, D) HCT-116 or HT29 cells were transfected with the indicated plasmids or siRNAs for 48 h. The protein levels of α3, P53, PTEN, IGFBP3, p-AKT, mTOR, p-mTOR, and E-cadherin were analyzed by Western blotting. (E, F) HCT-116 cells were transfected with the indicated siRNAs for 48 h. A portion of cells was harvested for Western blotting (E). The other portions were replated into Transwell plates overnight and stained with crystal violet (0.5% w/v) (F). (G) HCT-116 cells were treated with the mTOR inhibitors rapamycin (Rapa, 0.1 µM) and sapanisertib (Sapa, 0.5 µM) for 48 h, followed by crystal violet (0.5% w/v) staining to test cell migration. Scale bar, 100 µm. The data are expressed as the mean ± SEM (n=3). Two-way ANOVA with Bonferroni’s multiple comparisons test was used in (A, B). One-way ANOVA with Tukey’s multiple comparisons test was used in (F, G). *p ≤ 0.05, ***p ≤ 0.001.

