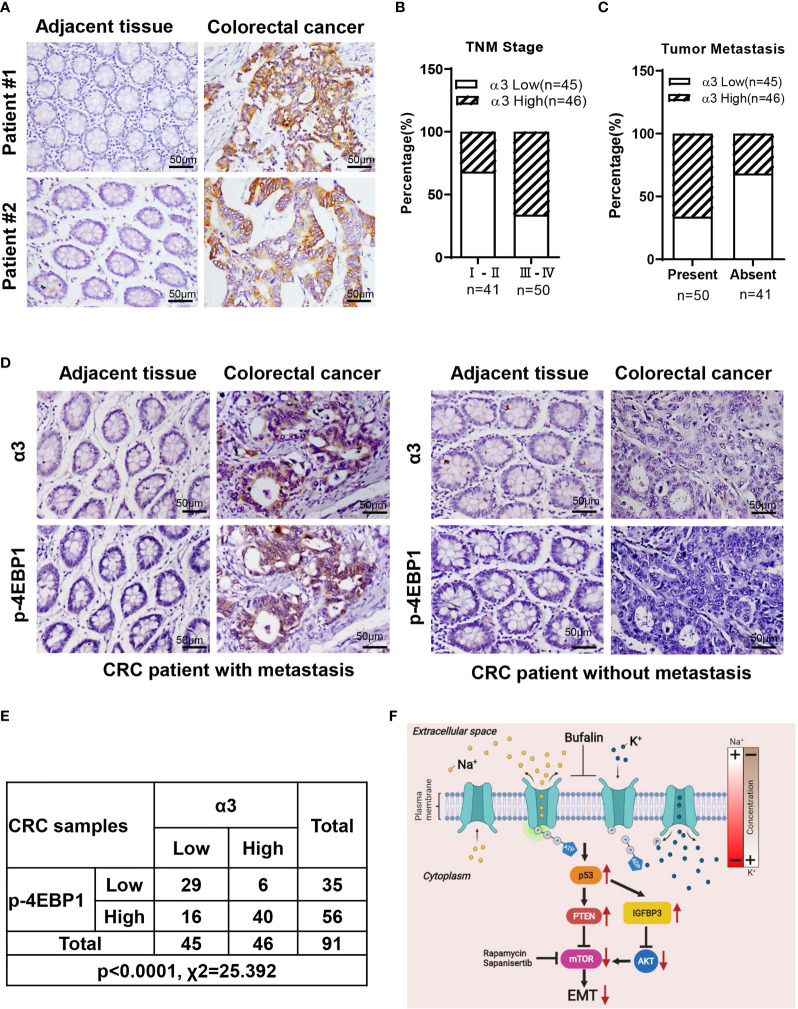
Figure 6.
Correlation between α3 and mTOR activity in 91 CRC tissues. (A) Representative images of IHC staining for α3 in CRC tissues and matched adjacent normal tissues. (B, C) The relationships between α3 and TNM stage (B) and metastasis (C) were determined. (D, E) The correlation between α3 and p-4EBP1 was evaluated in 91 CRC tissues and matched adjacent normal tissues. (F) A model of CRC cell metastasis driven by elevated α3 expression via the p53-PTEN/IGFBP3-mTOR axis, which is blocked by bufalin. Scale bar, 50 μm.

