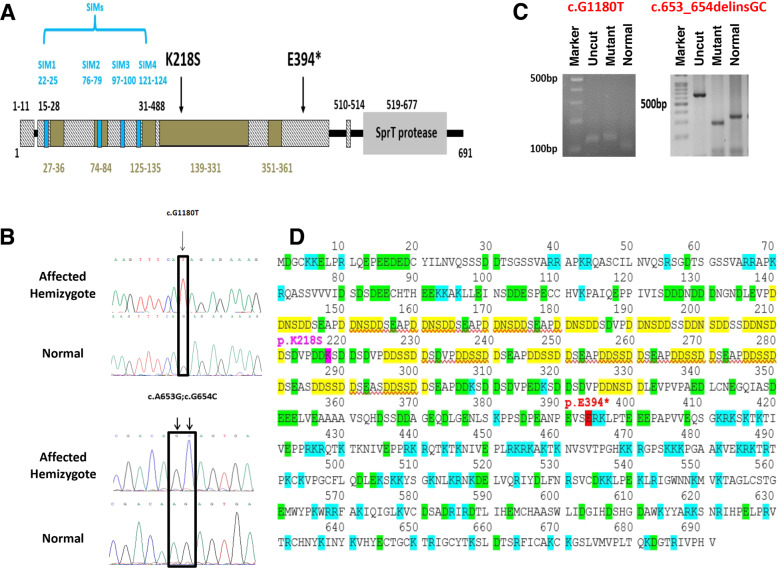
Fig. 2. The variations in GCNA and the structure of the protein.
A Diagram of the protein domains and the location of the PVs. The disorder region (IDR) is displayed in hatched bars, the low complexity regions within the (IDR) are shown in brown boxes and the SUMO interacting motives (SIM) in blue. The diagram is based on Pfam and SMART embl database, and the SIM repeats are according to Borgermann et al. [46]. B Chromatograms of Sanger sequences presenting the variation in GCNA in the patients in comparison to control. C Verification of the presence of the PVs in NOA patients of the Arab population was done by RFLP on PCR products. c.G1180T was tetsted with the SfcI enzyme. Uncut: 123 bp, normal: 96 bp+27 bp, PV prevents restriction: 123 bp. Verification for the presence of the variation c.653_654delinsGC was done with BstI enzyme. Uncut 675 bp, normal 347 + 118 + (30*7), PV adds a restriction site 317 + 118 + (30*8). D The protein sequence of human GCNA. The location of the stop codon is red. The negatively charged DD(S/N)DD repeats are marked yellow. Positively and negatively charged amino acids are marked blue and green, respectively.

