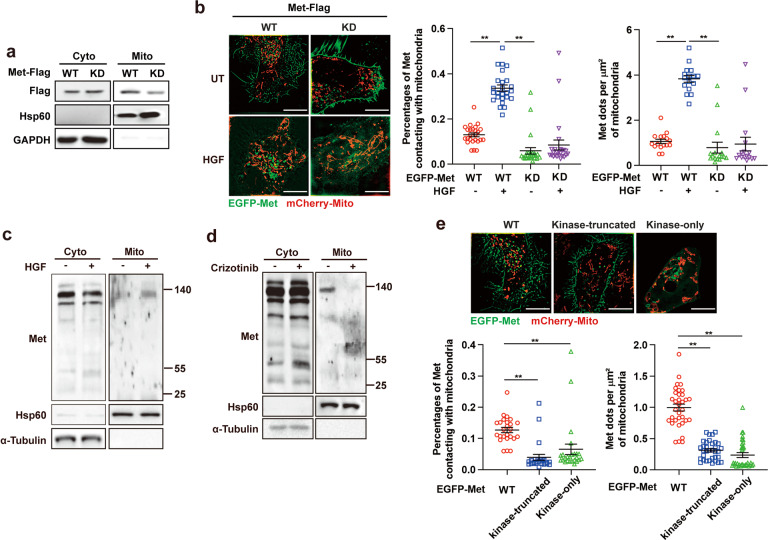
Fig. 2.
Kinase activity is required for mitochondrial trafficking of Met. a Immunoblot analysis of Flag-Met in mitochondrial and cytosolic fractions of Met-/− Huh7 cells stably transfected with WT Flag-Met and KD Flag-Met. Mitochondria isolation markers, GAPDH (cytoplasmic) and Hsp60 (mitochondria) were used as controls. b Met−/− HeLa cells stably expressing WT or KD EGFP–Met and mCherry–Mito were treated with HGF (100 ng/ml, 20 min) or not and then subjected to SIM live-cell imaging. Representative SIM images of mitochondrial localization of Met are shown. Scale bars, 10 µm. Quantification of percentages of Met contacting with mitochondria (n = 25 fields) and the number of Met dots docking at per µm2 of mitochondria (n = 16 fields). Error bars represent means ± SEM (**p < 0.01; Student’s t test). c, d Immunoblot analysis of intact and fragmented Flag-Met in mitochondrial and cytosolic fractions of Huh7 cells treated with HGF (100 ng/ml, 20 min) (c) or crizotinib (1 µM, 1 h) (d). Mitochondria isolation markers, α-Tubulin (cytoplasmic) and Hsp60 (mitochondria) were used as controls. e Representative SIM live-cell imaging of mitochondrial localization of Met in Met−/− HeLa cells stably transfected with WT, kinase-truncated or kinase-only EGFP–Met. Scale bars, 10 µm. Quantification of percentages of Met contacting with mitochondria (n = 25 fields) and the number of Met dots docking at per µm2 of mitochondria (n = 34 fields). Error bars represent means ± SEM (**p < 0.01; Student’s t test)

