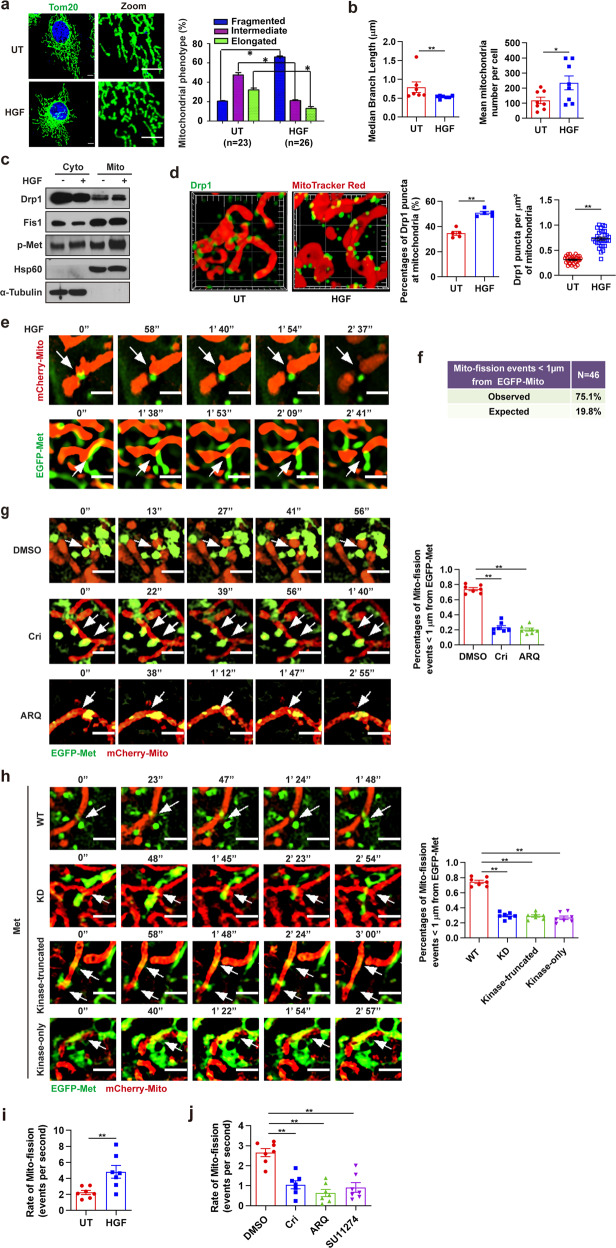
Fig. 3.
Mitochondrial fission is driven by Met kinase. a Huh7 cells were stimulated with HGF (100 ng/ml, 20 min) or not and then immunofluorescent stained for Met and Tom20. Percentages of cells with indicated mitochondrial morphologies were shown. Scale bars, 5 µm. Error bars represent means ± SEM (n represents the number of cells analyzed, *p < 0.05; Student’s t test). b Quantification of median branch length of individual mitochondria (n = 7 cells) and mean mitochondria number per cell (n = 8 cells) according to (a). Error bars represent means ± SEM (*p < 0.05, **p < 0.01; Student’s t test). c Immunoblot analysis of Drp1 and p-Met (Y1234-5) in mitochondrial and cytosolic fractions of Huh7 cells treated with HGF (100 ng/ml, 20 min). Mitochondria isolation markers, α-Tubulin (cytoplasmic) and Hsp60 (mitochondria) were used as controls. d Huh7 cells stimulated with HGF (100 ng/ml, 20 min) were immunofluorescent stained for Drp1 and mitochondria. Representative 3D SIM images of Drp1 assembly in mitochondria were shown. Images were captured in Z-stacks (frame, 10 µm × 10 µm; main calibration, 1 µm). Quantification of percentages of Drp1 puncta at mitochondria (n = 5 fields) and Drp1 puncta at per µm2 of mitochondria (n = 31 fields). Error bars represent means ± SEM (**p < 0.01; Student’s t test). e Met−/− HeLa cells expressing WT EGFP-Met and mCherry–Mito were treated with HGF (100 ng/ml, 20 min). Representative time-lapse SIM live-cell imaging shows that Met contacts mitochondria at division sites before mitochondrial fission events happen (indicated with white arrows). Scale bars, 1 µm. Two fields were taken. f Quantification of percentages of mitochondrial division events that are marked by Met in HeLa cells transfected with WT EGFP-Met and mCherry–Mito (n = 46 events in 25 cells, p < 0.001, Fisher’s exact test). Quantified from SIM live-cell imaging described in (e). g Time-lapse SIM live-cell imaging shows Met contacts with mitochondria at the sites of mitochondrial division before fission (indicated with white arrows) in Met−/− HeLa cells expressing WT EGFP-Met and mCherry–Mito with crizotinib (1 µM, 1 h) or ARQ-197 (5 µM, 1 h) treatments. Scale bars, 1 µm. Percentages of mitochondrial fission (Mito-fission) events marked by Met are quantified. Error bars represent means ± SEM (**p < 0.01; Student’s t test). Data are representative of seven independent experiments, 46 events per experiment. h Time-lapse N-SIM live-cell imaging of Met contacting mitochondria at the sites of mitochondrial division before fission (indicated with white arrows) in Met−/− HeLa cells expressing WT, KD, kinase-truncated or kinase-only EGFP-Met and mCherry–Mito. Scale bars, 1 µm. Percentages of Mito-fission events marked by Met are quantified. Error bars represent means ± SEM (**p < 0.01; Student’s t test). Data are representative of seven independent experiments, 62 events per experiment. i, j Huh7 cells were treated with HGF (100 ng/ml, 20 min) (i), crizotinib (1 µM, 1 h), ARQ-197 (5 µM, 1 h) or SU11274 (1 µM, 1 h) (j), and then subjected to Live Cell Imaging. Mito-fission rates are quantified. Error bars represent means ± SEM (n = 7 cells, **p < 0.01; Student’s t test)

