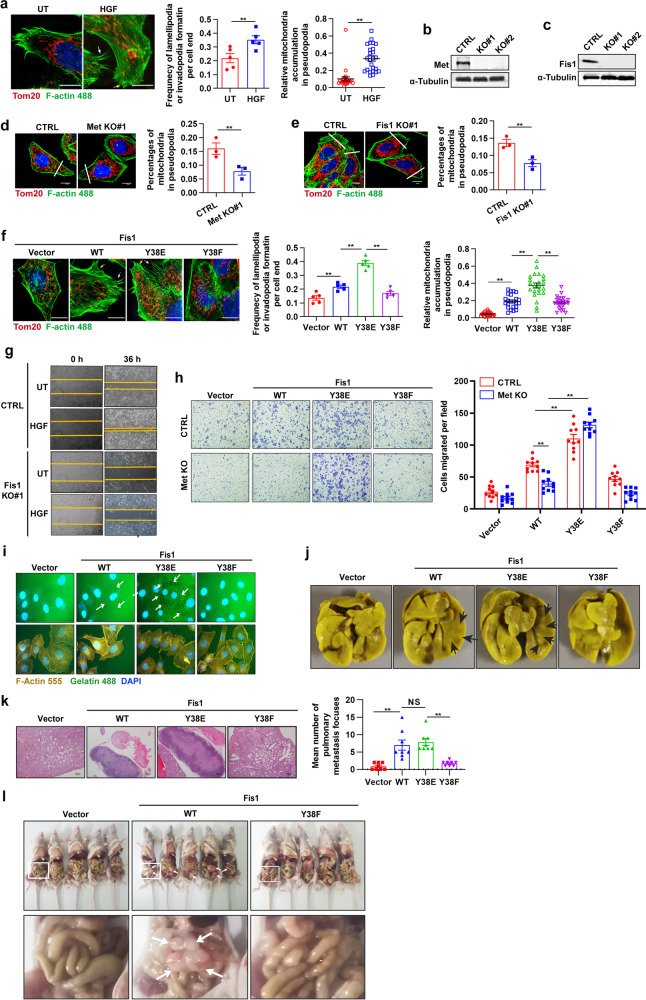
Fig. 6.
Met-mediated Fis1 Y38 phosphorylation facilitates cell metastasis in vitro and in vivo. a Representative SIM images of lamellipodia (yellow arrows) and invadopodia (white arrows) forming at the leading edge of Huh7 cells treated with HGF (100 ng/ml, 20 min). Mitochondria were stained with anti-Tom20 antibody and F-actin was stained with phalloidine. Scale bars, 10 µm. Quantification of the frequency of lamellipodia and (or) invadopodia formation of each cell end (n = 5 cells) and relative abundance of mitochondria in lamellipodia or invadopodia region (n = 25 cells). Error bars represent means ± SEM (**p < 0.01; Student’s t test). b, c Immunoblot analysis of Met knockout efficacy (b) or Fis1 knockout efficacy (c) in Huh7 cells using CRISPR-Cas9 technology. d, e Representative images of lamellipodia and (or) invadopodia at the leading edge of Met−/− (d) or Fis1−/− (e) Huh7 cells. Quantification of relative abundance of mitochondria in the lamellipodia or invadopodia region. Scale bars, 10 µm. Error bars represent means ± SEM (n = 3 cells, **p < 0.01; Student’s t test). f Representative SIM images of lamellipodia (yellow arrows) and invadopodia (white arrows) forming at the leading edge of Fis1−/− Huh7 cells re-expressed with indicated plasmids. Mitochondria were stained with anti-Tom20 antibody and F-actin was stained with phalloidine. Scale bars, 10 µm. Quantification of the frequency of lamellipodia and (or) invadopodia formation of each cell end (n = 5 cells) and relative abundance of mitochondria in lamellipodia or invadopodia region (n = 23 cells). Error bars represent means ± SEM (**p < 0.01; Student’s t test). g Representative images of wound healing assay in WT or Fis1−/− Huh7 cells stimulated with HGF (100 ng/ml) for indicated time or not, implying the migration ability. h Fis1−/− Huh7 cells with Met knocked out or not were transfected with indicated plasmids. Transwell assay was applied to examine the migration ability of these cells. Quantification of cells migrated per field. Error bars represent means ± SEM (n = 10 fields, **p < 0.01; Student’s t test). i Representative images of cytoskeleton morphology in Fis1−/− huh7 cells transfected with indicated plasmids. Cells were stained with F-actin 555 and incubated in an extracellular matrix substituted with F-488 conjugated gelatin. The white arrows indicate the gelatin degraded by cancer cells (dark spots). j, k Fis1−/− Huh7 cells re-expressed with indicated plasmids were injected to nude mice for 1 × 10⁶/mouse through tail vein, pulmonary metastasis was tested after 28 days. Representative nodules on the pulmonary surface after picric acid staining for 6 h (j). Representative images of lung histological sections with HE staining (k, left). Scale bars, 100 µm. Quantification of the mean number of lung metastases per mice (k, right). Error bars represent means ± SEM (n = 8 mice, **p < 0.01, NS denotes no statistical significance; Student’s t test). l Nude mice were intraperitoneally inoculated with Fis1−/− Huh7 cells re-expressed with indicated plasmids (n = 5 mice) and tumor nodes in the abdominal cavity were observed after 21 days. The white arrows indicate the tumor nodes on the peritoneum. The zoomed images are shown below

