
Fig. 5. Structures of mitochondrial genes in ‘CMS[P]’.
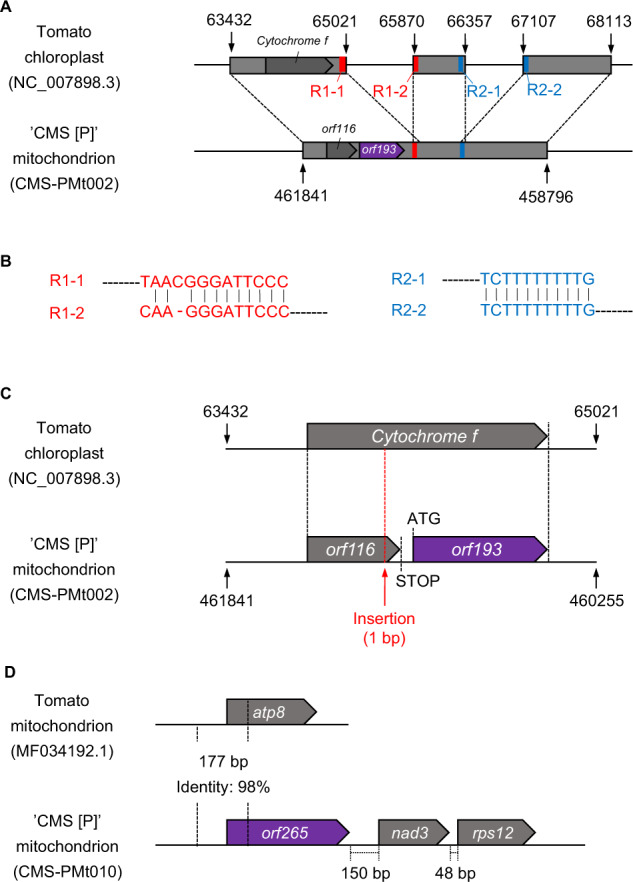
A Genome structure of the orf193 region. Homologous sequences between the two genomes are indicated by gray boxes. Highly conserved sequences at the borders are shown in red and blue. B Sequence alignments of the borders. C Details of the genome structure of the orf193 region. A single nucleotide insertion causing a frame-shift mutation is indicated with a red arrow. D Genome structure of the orf265 region