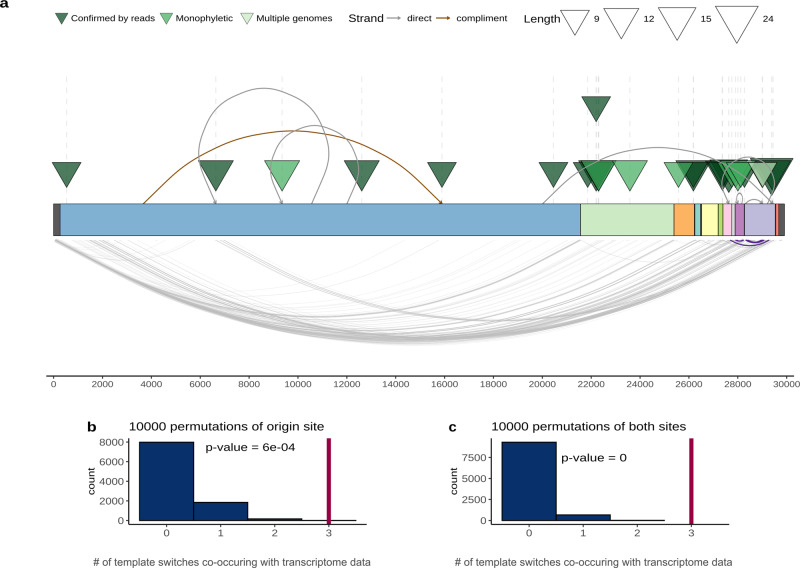
Fig. 2. Long insertions possibly occur through template switching and formation of nc sgRNAs.
a Each triangle shows an independent insertion event, colored as in Fig. 1. Curves on the upper side of the plot connect the insertion origin site and insertion position, brown color indicates that the origin sequence is on the same strand, and gray color shows that the origin sequence is on complementary strand, curves at the bottom of the plot represent the experimental data on sgRNAs from Kim et al.26. Curves highlighted in violet correspond to the three cases when insert and corresponding origin site co-occur with sgRNA junctions. The SARS-CoV-2 genes are colored as in Fig. 1. Permutation tests show the number of template switches co-occurring with RdRp jumps (x-axis) expected at random (blue), (b) when only the positions of the origins were randomly sampled 10,000 times from the genome; c when both ends were randomly sampled. Red vertical line represents the number observed in data. The code to reproduce the permutation tests is available in repository (see Code availability).

