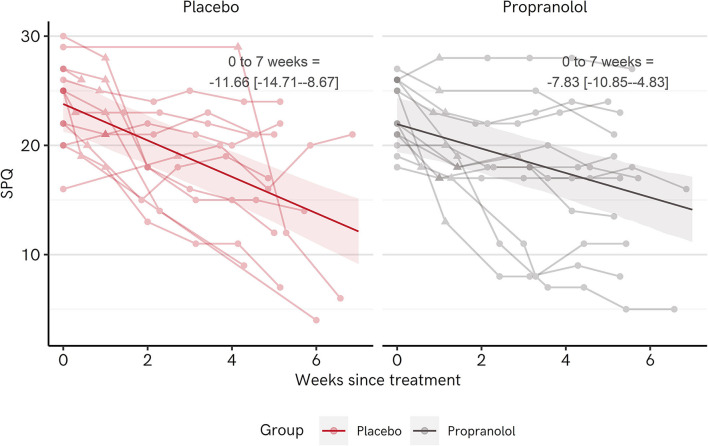
Figure 7.
Change in spider phobia questionnaire (SPQ) scores over time for each group in Experiment 2. The dark lines and ribbons represent fitted point estimates and 95% highest density intervals (HDIs) from the regression model. Points along faded lines represent responses of individual participants. The triangular point designates the score measured in the post-treatment session. 0–7 weeks = change from pre-treatment to 7 weeks post-treatment, respectively, with point estimate and [95% HDI].

