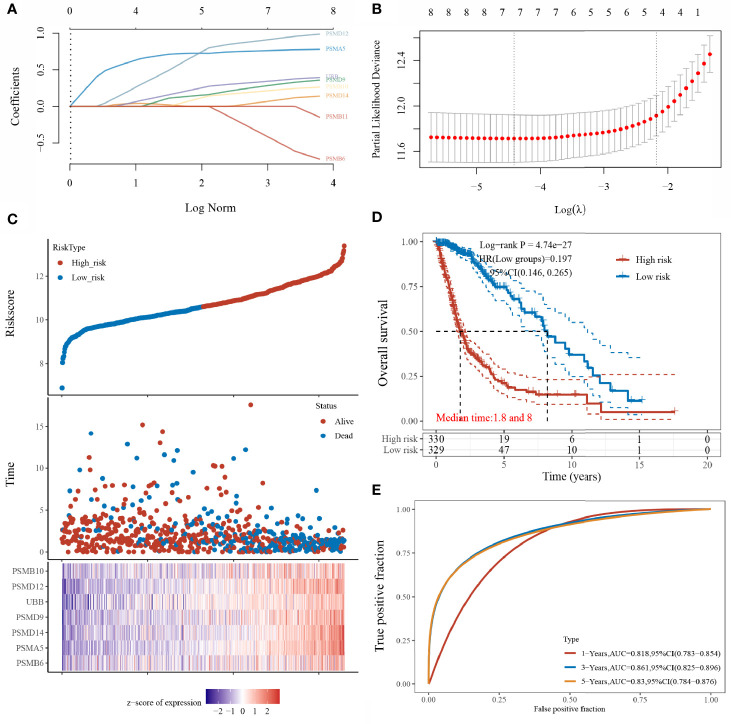
Figure 5.
Construction of the LASSO prognostic model. (A) Coefficients of selected features shown by lambda parameters; (B) partial likelihood deviation plotted against log(λ) using LASSO-Cox regression model; (C) risk score and survival time with survival status profile and expression levels of the seven gene signatures; (D) Kaplan–Meier curves for patients in the high- and low-risk groups; and (E) ROC curve validation (LASSO model for 1-, 3-, and 5-year prediction accuracies).

