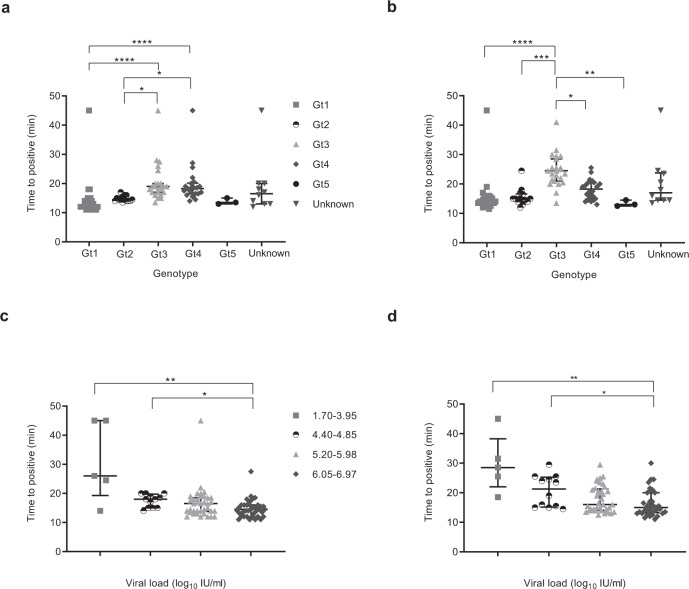
Fig. 1. The effect of genotype and viral load on detection.
The central lines indicate median with interquartile range as error bars, and each point on the graph represents the mean of a sample run in duplicate. False negative samples were recorded as time to positive reaction at 45 min. Statistical analysis was performed using a one-sided non-parametric Kruskal-Wallis with Dunn’s multiple comparisons test (one-sided). *p ≤ 0.05, **p ≤ 0.01, ***p ≤ 0.001, ****p ≤ 0.0001. a HCV RNA samples detection based on genotype (Gt): Gt1 (grey square, n = 26), Gt2 (white and black disc, n = 14), Gt3 (grey triangle, n = 23), Gt4 (grey lozenge, n = 22), Gt5 (black disc, n = 3), Unknown (grey inverse triangle, n = 10). Gt1 vs Gt3, p < 0.0001, Gt1 vs Gt4, p < 0.0001, Gt1 vs Unknown, p = 0.1524, Gt2 vs Gt3, p = 0.0101, Gt2 vs Gt4, p = 0.0284, Gt3 vs Gt5, p = 0.1846, Gt4 vs Gt5, p = 0.2814. All remaining groups had p values of >0.9999. b HCV cDNA samples detection based on genotype; Gt1 (grey square, n = 26), Gt2 (white and black disc, n = 14), Gt3 (grey triangle, n = 23), Gt4 (grey lozenge, n = 22), Gt5 (black disc, n = 3), Unknown (grey inverse triangle, n = 10). Gt1 vs Gt3, p < 0.0001, Gt1 vs Gt4, p = 0.0562, Gt1 vs Unknown, p = 0.3425, Gt2 vs Gt3, p = 0.0002, Gt3 vs Gt4, p = 0.0490, Gt3 vs Gt5, p = 0.0035, Gt3 vs Unknown, p = 0.3247, Gt4 vs Gt5, p = 0.3701, Gt5 vs Unknown, p = 0.5210. All the remaining groups had p values of >0.9999. c HCV RNA samples detection based on viral load: 1.7–3.95 (grey square, n = 5), 4.4–4.85 (black and white disc, n = 11), 5.2–5.98 (grey triangle, n = 34), 6.05–6.97 (grey lozenge, n = 44). 1.7–3.95 vs 5.2–5.98, p = 0.1937, 1.7–3.95 vs 6.05–6.97, p = 0.0095, 4.4–4.85 vs 6.05–6.97, p = 0.0301, 5.2–5.98 vs 6.05–6.97, p = 0.4768, 5.2–5.98 vs Unknown, p = 0.4506, 6.05–6.97 vs Unknown, p = 0.0118. All remaining groups had p values of >0.9999. d HCV cDNA samples detection based on viral load; 1.7–3.95 (grey square, n = 5), 4.4–4.85 (black and white disc, n = 11), 5.2–5.98 (grey triangle, n = 34), 6.05–6.97 (grey lozenge, n = 44). 1.7–3.95 vs 5.2–5.98, p = 0.0536, 1.7–3.95 vs 6.05–6.97, p = 0.0032, 1.7–3.95 vs Unknown, p = 0.5693, 4.4–4.85 vs 6.05–6.97, p = 0.0492, 5.2–5.98 vs 6.05–6.97, p = 0.9431, 6.05–6.97 vs Unknown, p = 0.7858. All remaining groups had p values of >0.9999. Source data are provided as a Source data file.

