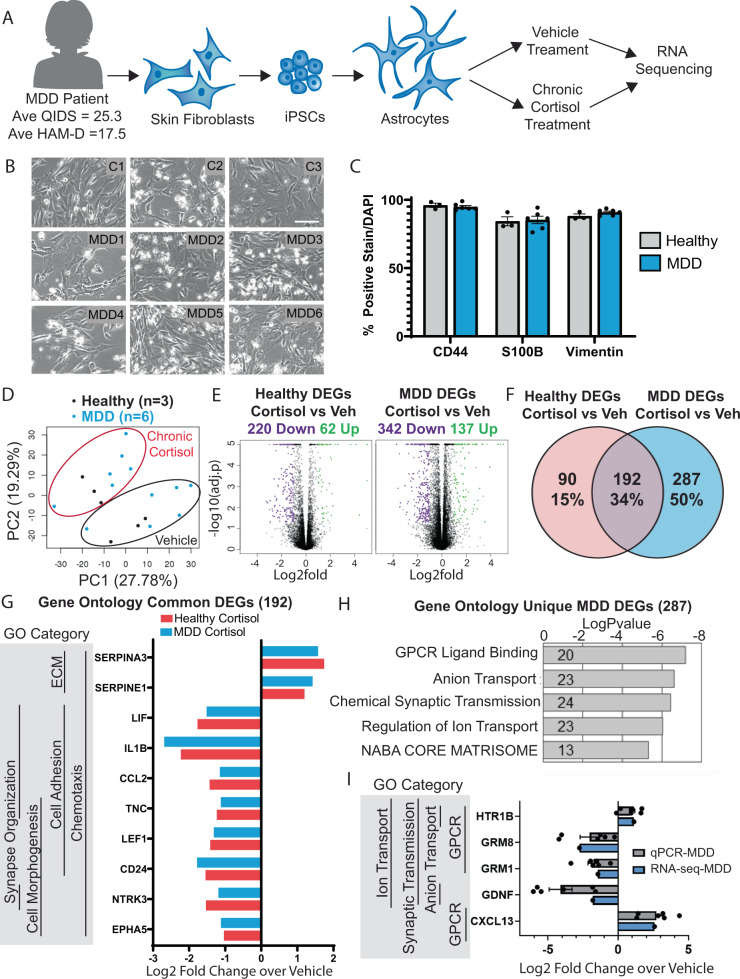
Fig. 3. Chronic cortisol treatment elicts a unique transcriptional response in astrocytes derived from patients with MDD.
a Schematic showing the process of deriving astrocytes from Major Depression (MDD) patient skin samples and treatment with chronic cortisol for RNA-sequencing. b Bright field representative images of astrocytes differentiated from 3 healthy control individuals and 6 MDD patients; scale bar = 100 µm. c Quantification of astrocyte marker expression measured via immunostain. Bars show mean ± SEM, n = 6 individuals (individuals are represented by dots). d Principal component analysis of transcriptome sequencing data in all treated samples; black dots = healthy individuals, blue dots = MDD individuals. e Volcano plots depicting differentially expressed genes (DEGs) upregulated (green dots) or downregulated (purple dots) following treatment with cortisol; n = 3 (Healthy); n = 6 (MDD). f Venn diagram comparison of DEGs unique to each cohort and those that overlap. g Selected highly significant genes regulated by chronic cortisol in both healthy and MDD individuals with top gene ontology categories, left. h Top gene ontology categories from DEGs unique to MDD (287 genes); bars represent the logPvalue of the term and numbers within the bar represent the genes in our list under that term. i Selected highly significant genes in top GO categories unique to MDD confirmed by RT-qPCR; bars show mean log2fold change over vehicle ± SEM for n = 6 (individuals are represented by dots).

